












VibeFox Auto Fibonacci MT5
30,00 €
VibeFox Auto Fibonacci is a real-time overlay for MetaTrader 5 that draws the Fibonacci retracement grid for you. It automatically detects the latest significant price swing, anchors the 0% and 100% levels on it, and paints the full set of retracement levels, the optimal-trade-entry (OTE) zone and, on request, the extension targets — right on the price chart. Instead of dragging the fib tool by hand after every move, you always see an up-to-date grid, and you get an alert the moment price returns to a key level. Every control is gathered into one modern interactive panel.
VibeFox Auto Fibonacci — automatic swing retracement grid with OTE zone and touch signals
VibeFox Auto Fibonacci is a real-time overlay for MetaTrader 5 that draws the Fibonacci retracement grid for you. It automatically detects the latest significant price swing, anchors the 0% and 100% levels on it, and paints the full set of retracement levels, the optimal-trade-entry (OTE) zone and, on request, the extension targets — right on the price chart. Instead of dragging the fib tool by hand after every move, you always see an up-to-date grid, and you get an alert the moment price returns to a key level. Every control is gathered into one modern interactive panel.
How the indicator works
The indicator works in two stages. First it builds the swing structure with a ZigZag engine driven by fractal pivots: a bar becomes a pivot high when it is the strict maximum of the window of Depth bars on each side, and a pivot low symmetrically. A new pivot is accepted into the zigzag only when it has moved far enough away from the previous one — the threshold is Deviation multiplied by the current ATR, so the filter scales automatically with volatility. Using ATR units means the same setting behaves sensibly on a quiet pair and on a fast one.
Second, it takes the last two accepted pivots — the previous one and the most recent one — as the impulse the grid is built on. The prior pivot becomes the 0% anchor (impulse start) and the latest pivot becomes the 100% anchor (impulse end). The direction follows the structure: if the latest pivot is a high, the impulse is up; if it is a low, the impulse is down. The retracement grid is then drawn between the swing low and the swing high, and it is rebuilt automatically each time a fresh swing forms.
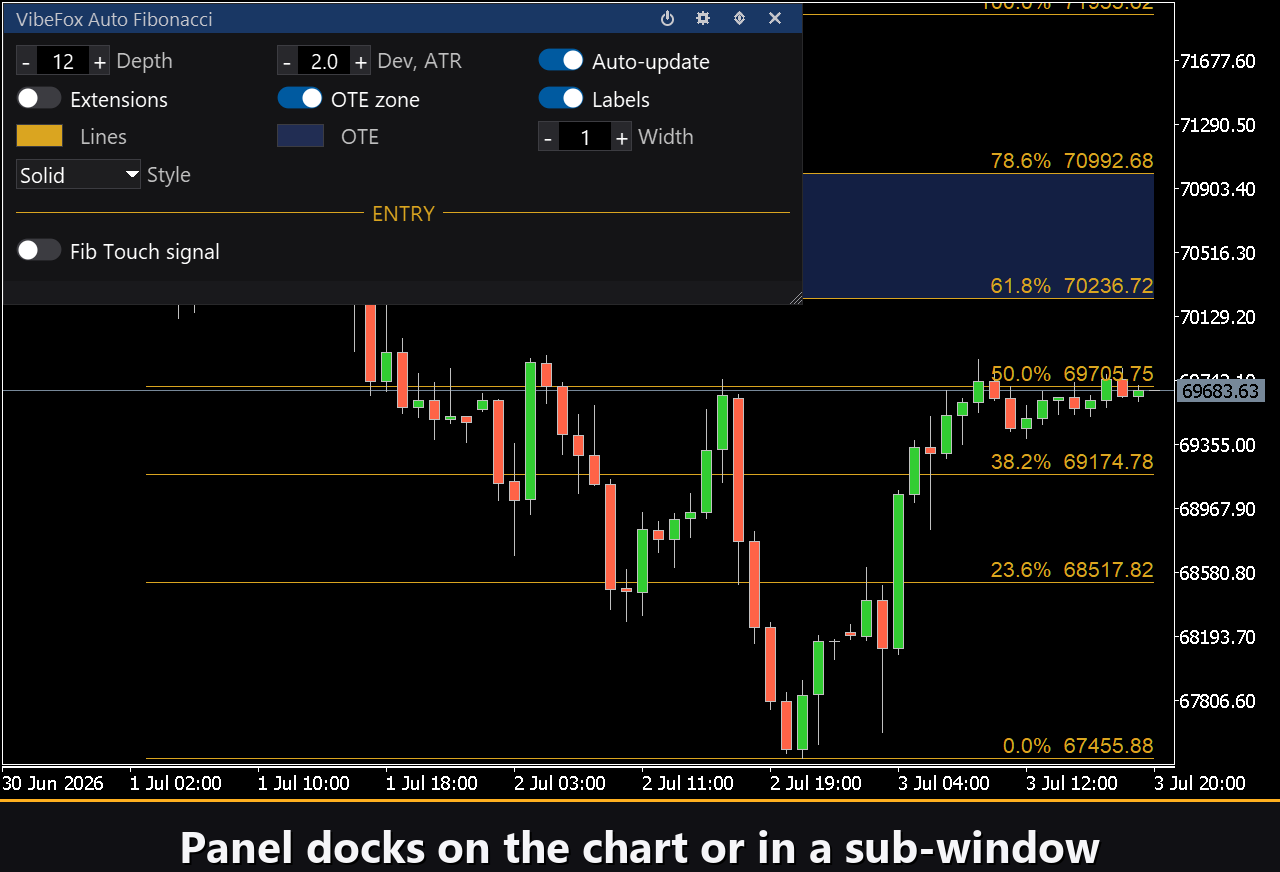
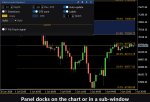
The fib grid, OTE zone and labels are drawn directly on the price chart as objects, while the indicator itself lives in its own subwindow, where the control panel sits.
The Fibonacci grid
The base grid covers the classic retracement ratios: 0, 0.236, 0.382, 0.5, 0.618, 0.786 and 1.0. Level 0 sits at the end of the impulse and level 1.0 at its start, so 0.618 is the classic 61.8% pullback into the move. These levels act as support and resistance where a pullback is likely to pause or reverse.
The OTE zone (Optimal Trade Entry) is the band between 0.618 and 0.786. It is the area many traders watch for a continuation entry in the direction of the impulse — deep enough to give a good price, shallow enough to keep the structure intact. The indicator shades this band as a semi-transparent rectangle so it stands out at a glance.
The optional extensions — 1.272 and 1.618 — project beyond the end of the impulse and serve as profit targets: where price may travel once the pullback is over and the trend resumes.
Entry points and the touch signal
The Fib Touch signal turns the grid into an alerting tool. When it is enabled, the indicator watches each newly closed bar and fires when the bar’s range reaches a key level — the 0.618 line or anywhere inside the OTE zone (0.618-0.786) — within a tolerance of Near multiplied by ATR. The signal fires once per bar and is de-duplicated by level, so you are notified exactly when price returns to the optimal entry area, not on every tick. This is the moment a continuation trade is typically planned.
Full visual control
The level line color is set with Lines and its thickness with Width from 1 to 10 pixels; the Style selector switches between Solid, Dash, Dot, DashDot and DashDotDot. The OTE band has its own OTE color, drawn semi-transparent so the candles stay readable through it. Both the line color and the OTE fill have an independent transparency setting (0-100%), so you can blend the grid softly into the chart background. Labels add a text tag with the price and the percent on each level, and can be turned off for a cleaner look.
Interactive on-chart panel
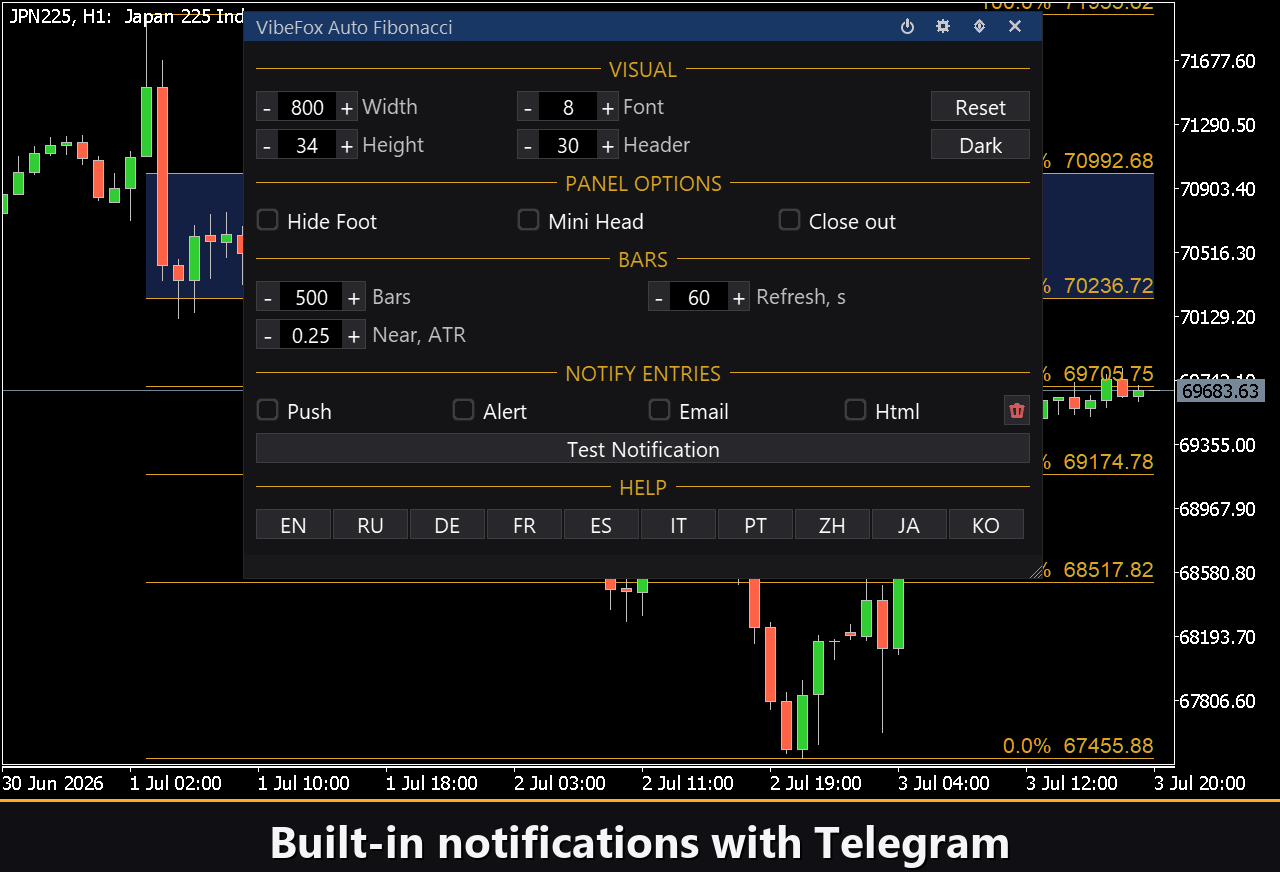
The whole interface is a smooth canvas-based panel built for fast mouse control. The parameters are gathered into tidy rows — Swing, then Levels, then Visual — and the entry block is set apart with its own gold ENTRY heading, so signal settings do not get mixed up with drawing settings. The panel header holds the control icons.
Power — turns the drawing of the grid and the signals on and off without removing the indicator from the chart.
Settings (gear) — opens and closes the settings section.
Updown (arrows) — moves the panel between its subwindow and the main chart.
Close (cross) — closes the indicator.
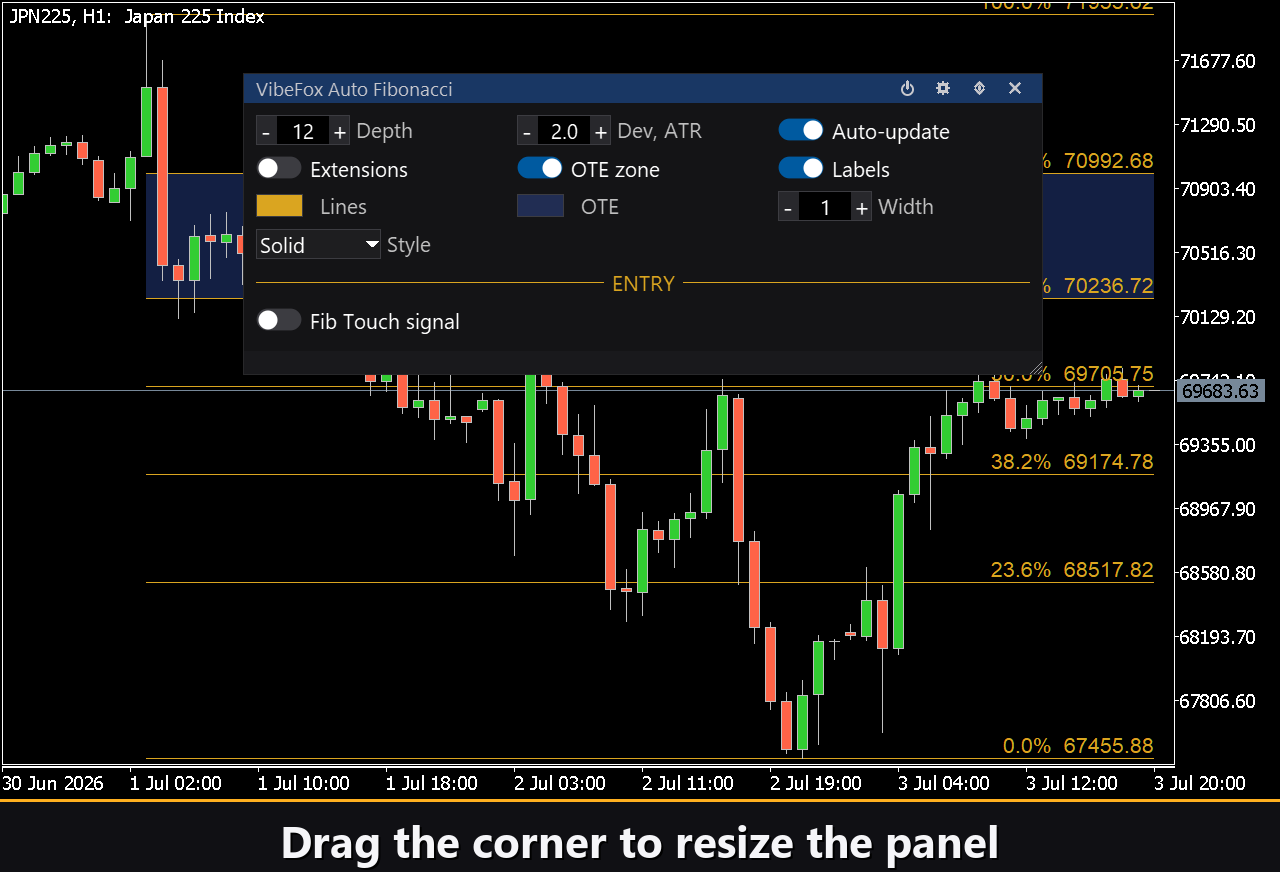
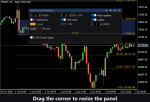
Resizable — drag the bottom-right corner to scale the panel.
Collapsible — a double click on the header collapses the panel into a compact strip.
Mouse wheel — hover over any numeric field and scroll the wheel to change the value without opening the keyboard.
Settings and personalization
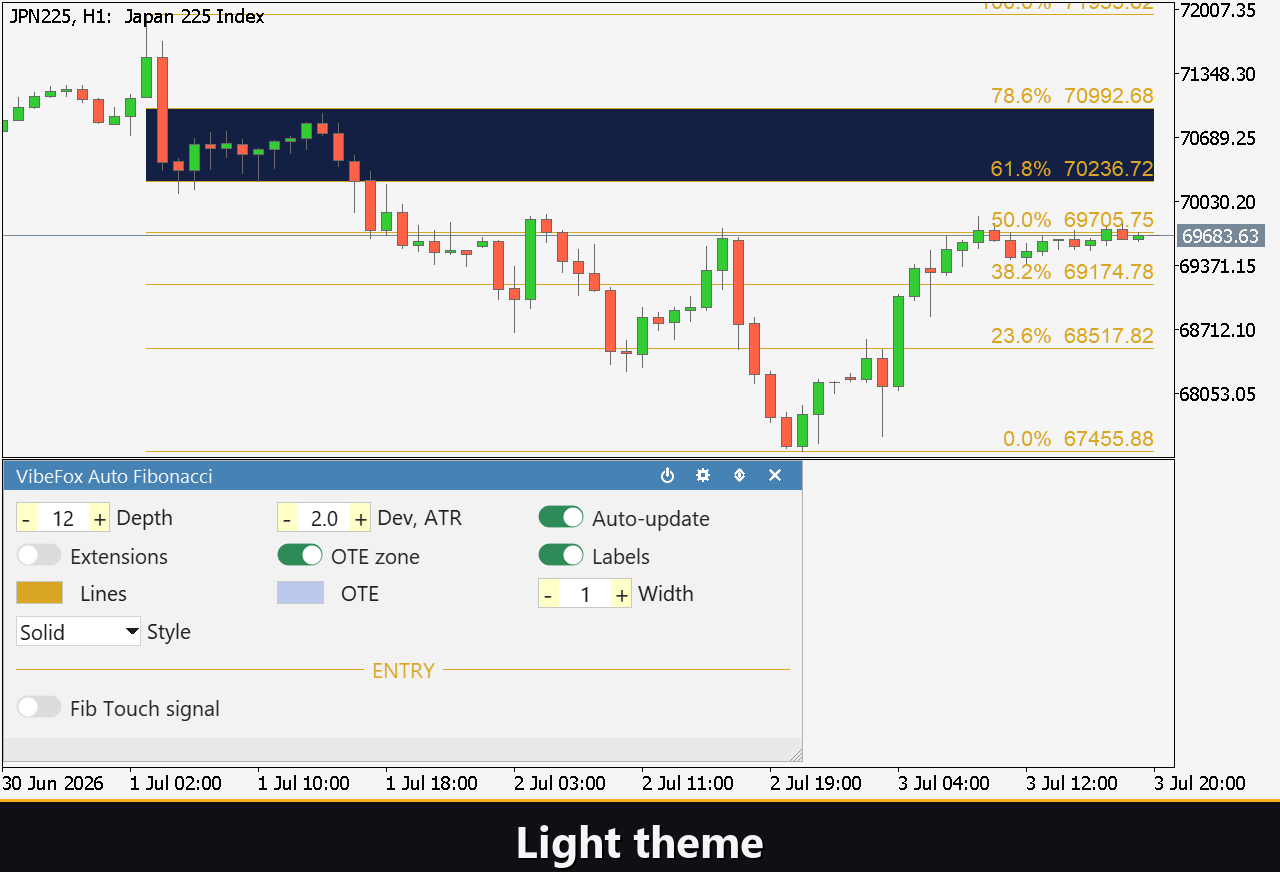
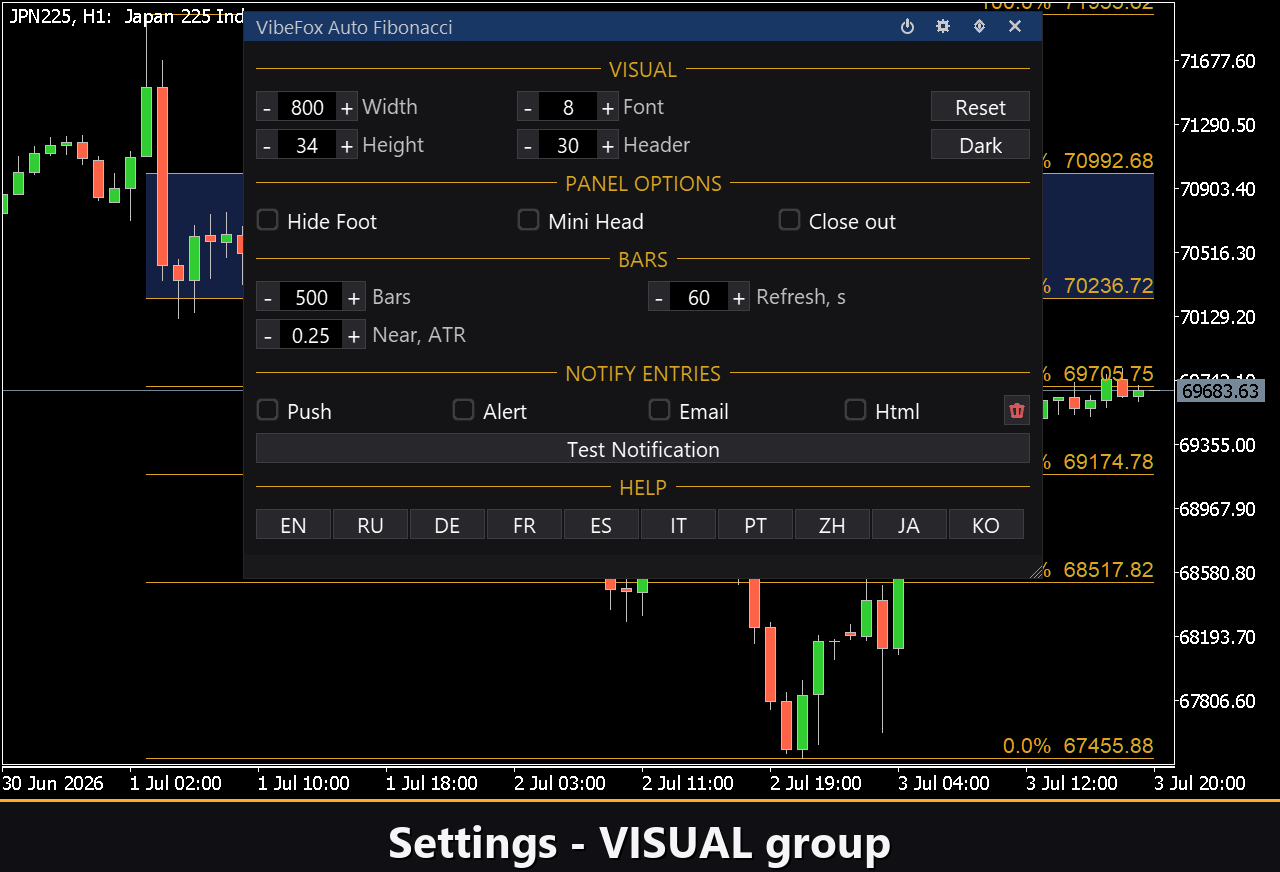
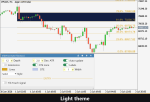
The Settings button opens a section where the panel is fitted to your workspace: a light, dark or automatic Theme, an adjustable panel width, header size, row height and font size. Extra touches let you hide the bottom bar via Hide Footer, shrink the header when collapsed with Mini Header, and automatically collapse the panel on a click outside it. The Settings section also carries a BARS group: Bars sets how many bars are scanned for the swing, Refresh is an auto-refresh interval in seconds (0 = off), and Near is the touch tolerance in ATR units. Almost every parameter changes live right on the panel — the input fields only set the starting values. You can also run several independent copies on one chart by giving each a unique Instance.
Entry notifications
You do not need to sit and watch the chart waiting for price to return to the grid. Each Fib Touch signal can be sent through several notification channels that are enabled independently right on the panel.
Alert — a pop-up message inside the terminal.
Push — a mobile notification to the MetaTrader app on your phone.
Email — a letter sent through the terminal’s mail settings.
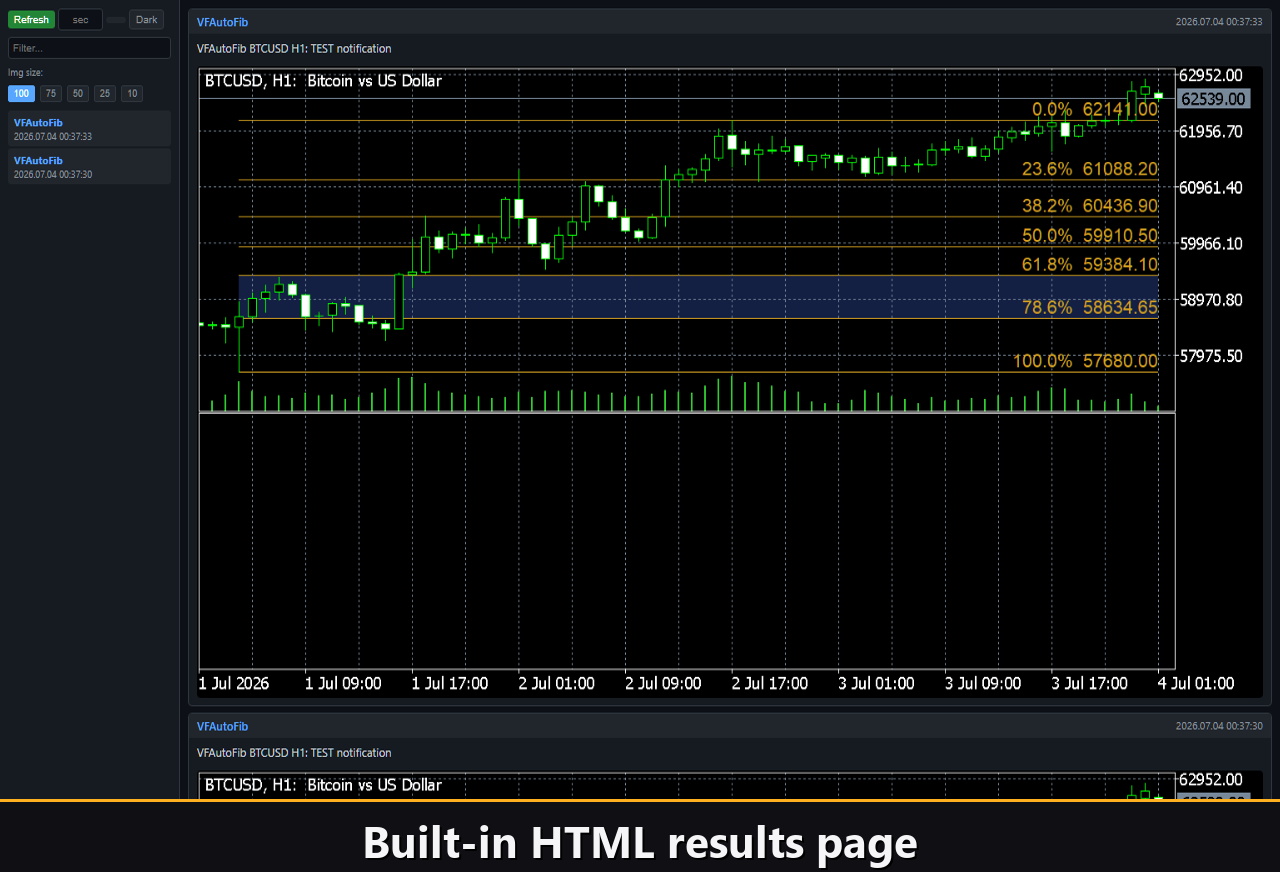
Html — a report card with a chart screenshot (see below).
Enable only the channels you need, and you will be notified the moment price touches a key level on the symbol and timeframe you are working with. A Test Notification button sends a sample signal over the enabled channels so you can verify your setup.
Visual history (HTML report)
Enable the Html channel, and every touch signal is saved to an HTML report together with a screenshot of the chart at the moment it fired. Before the screenshot is taken the panel hides itself for one frame, so the report shows the clean chart with the fib grid and not the panel overlay. The report is stored in the terminal’s Files folder, in the VibeFox_AutoFib directory (MQL5/Files/VibeFox_AutoFib/result.html), and opens in any browser — a visual log of every level the market tested. A one-click trash button clears the report and its screenshots whenever you want to start over.
Built-in multilingual help
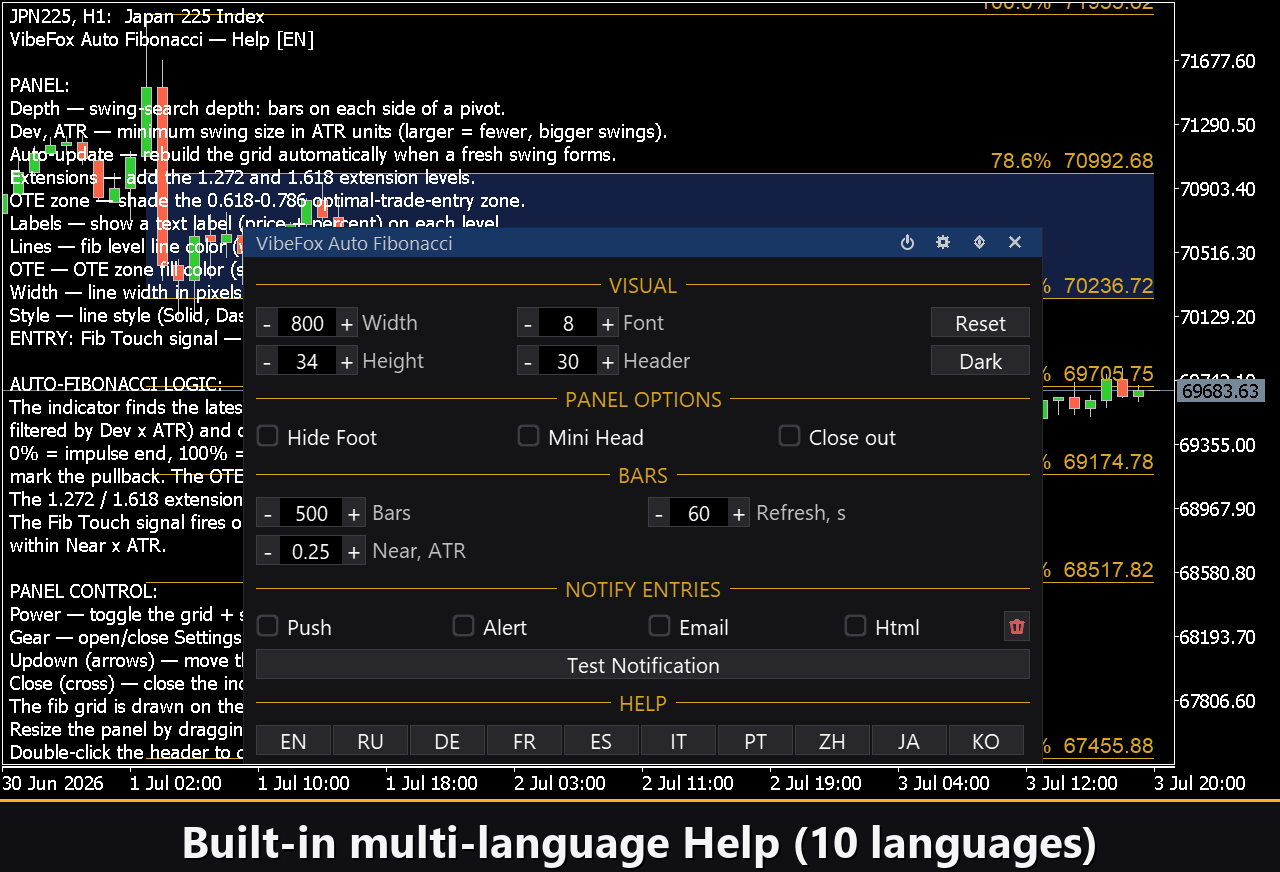
A full help page is built into the panel, available in 14 languages, so every control is explained right where you use it. Toggle it from the HELP group in Settings; the text appears as a chart comment and clears on a second click.
Loading...