











VibeFox AMA MT5
30,00 €
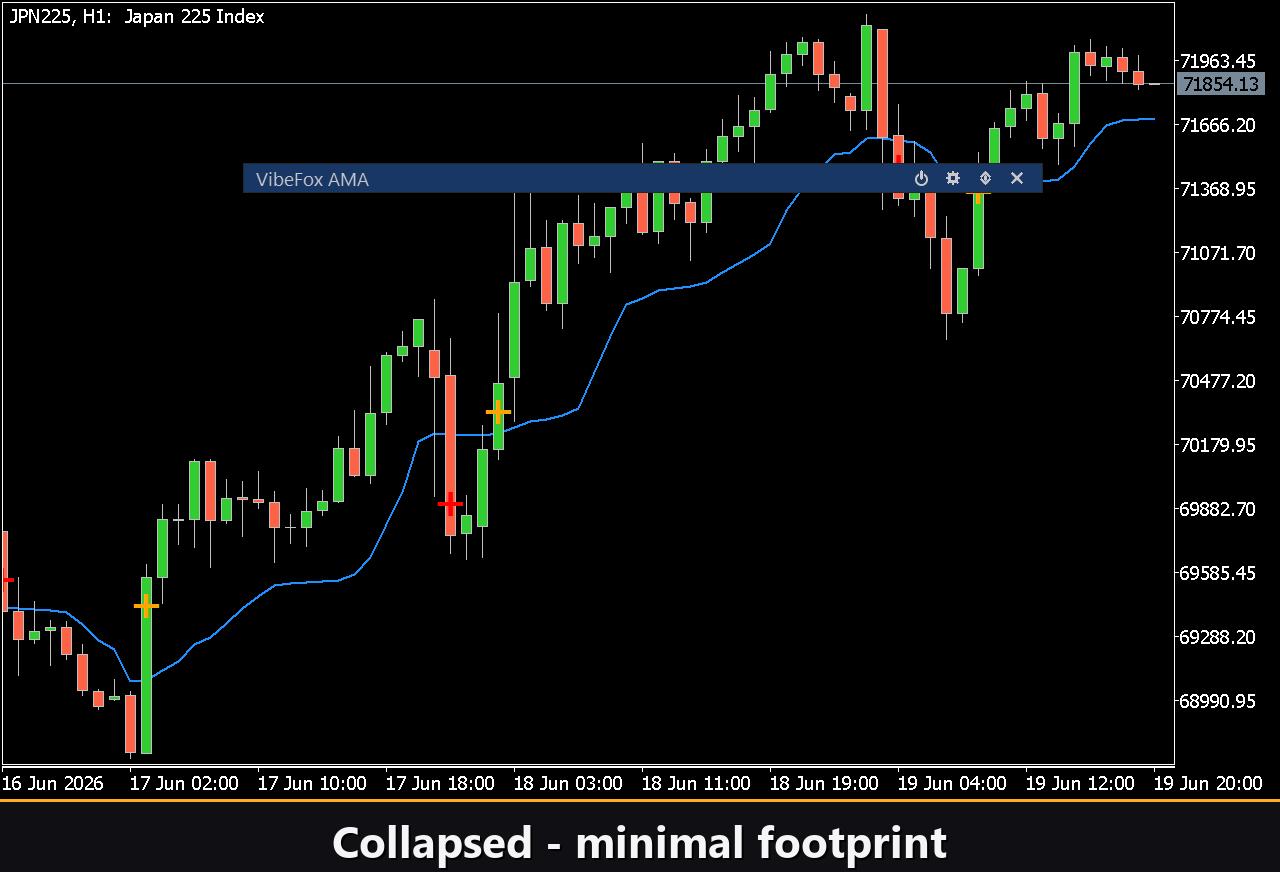
VibeFox AMA is a real-time Kaufman Adaptive Moving Average indicator for MetaTrader 5. It plots the classic KAMA line directly on the price chart, marks entry signals the moment they form, and gathers all the controls into one modern interactive panel. Instead of switching between settings dialogs and squinting at a slowly adapting line, you see exactly how fast the average is tracking the price — and where a signal has just appeared.
VibeFox AMA — Adaptive Moving Average with entry signals and interactive panel
VibeFox AMA is a real-time Kaufman Adaptive Moving Average indicator for MetaTrader 5. It plots the classic KAMA line directly on the price chart, marks entry signals the moment they form, and gathers all the controls into one modern interactive panel. Instead of switching between settings dialogs and squinting at a slowly adapting line, you see exactly how fast the average is tracking the price — and where a signal has just appeared.
How AMA adapts
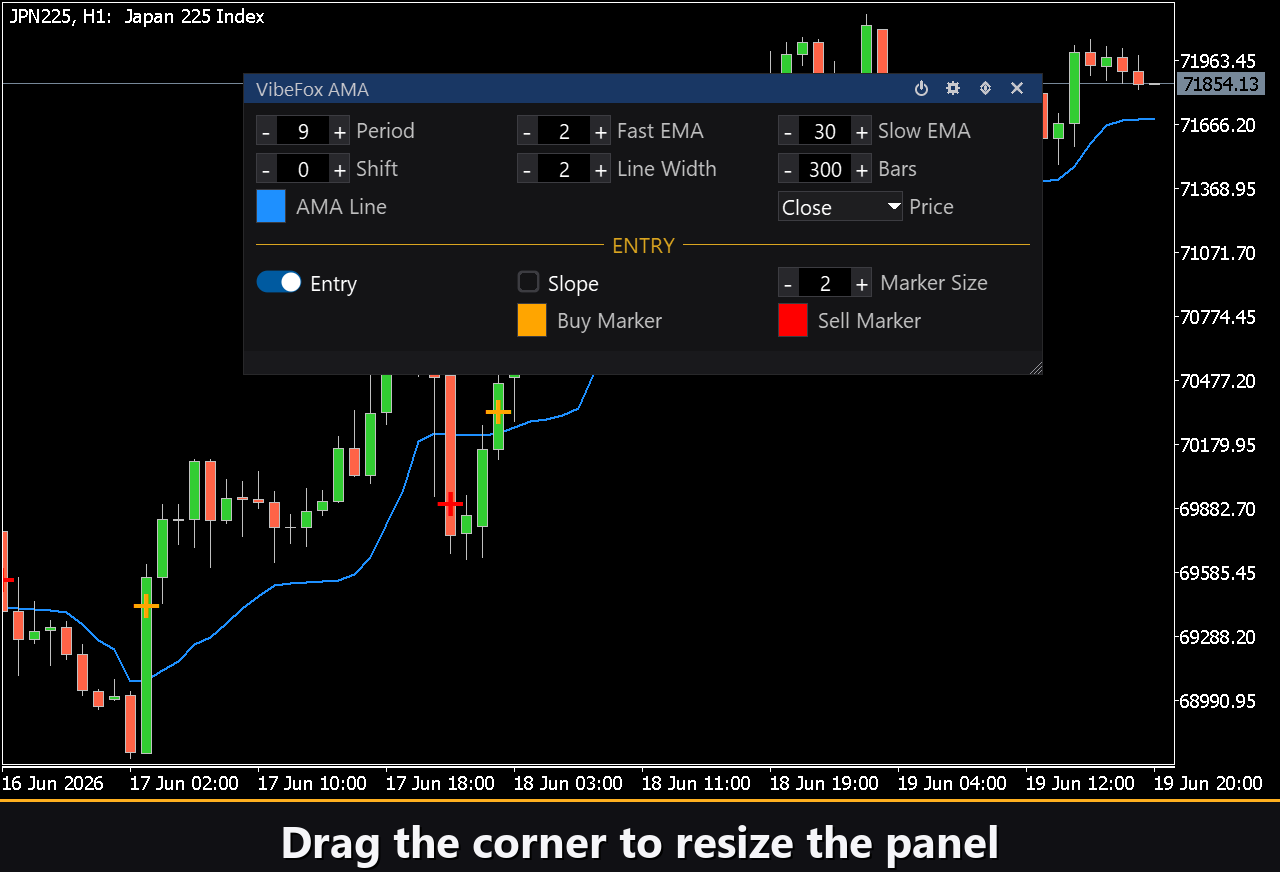
The core of the indicator is the Efficiency Ratio (ER): the ratio of the net directional move to the total path covered over the AMA Period. When the market is trending cleanly, ER is high and the AMA line follows the price closely. When the market is choppy or sideways, ER falls toward zero and the AMA barely moves — it effectively filters out the noise.
The speed of adaptation is controlled by Fast EMA and Slow EMA. They define the two extremes of the smoothing coefficient: at maximum efficiency the AMA behaves like a fast EMA, at minimum efficiency it slows down to the pace of a slow EMA. Adjusting these two periods sets how aggressively the line reacts to a change in market character.
Applied Price selects which price series — Close, Open, High, Low, Median, Typical or Weighted — feeds the calculation. AMA Shift lets you offset the line horizontally by a set number of bars, and Bars to Analyze limits how far back the history is calculated.
Entry points
The indicator offers two independent entry modes that can be enabled or disabled on the panel at any time.
Entry — Px Cross
A BUY arrow appears when the price crosses the AMA line from below; a SELL arrow appears when the price crosses from above. This mode catches the moment the market commits to a side after a period of uncertainty.
Slope entry — slope reversal
A BUY arrow appears when the AMA slope turns upward; a SELL arrow appears when it turns downward. Because the KAMA line barely moves in sideways conditions, this mode generates far fewer false signals during consolidation than a traditional moving average slope.
Full visual control
The AMA line is drawn directly on the price chart — no separate subwindow needed. You can set the line color, width and transparency independently. Buy and Sell markers each have their own color and transparency settings, and a Marker Size control scales the arrows from subtle to clearly visible. Every visual parameter can be tweaked live on the panel without reopening the inputs dialog.
Interactive on-chart panel
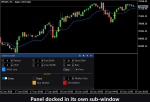
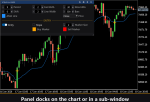
The whole interface is a smooth canvas-based panel built for fast mouse control.
Power — turns the drawing of lines and signals on and off without removing the indicator from the chart.
Settings (gear) — opens and closes the settings section.
Updown (arrows) — moves the panel between a separate subwindow and the main chart.
Close (cross) — closes the indicator.
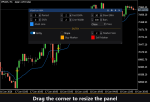
Resizable — drag the bottom-right corner to scale the panel.
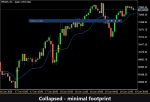
Collapsible — a double click on the header collapses the panel into a compact strip.
Mouse wheel — hover over any numeric field and scroll the wheel to change the value without opening the keyboard.
Settings and personalization
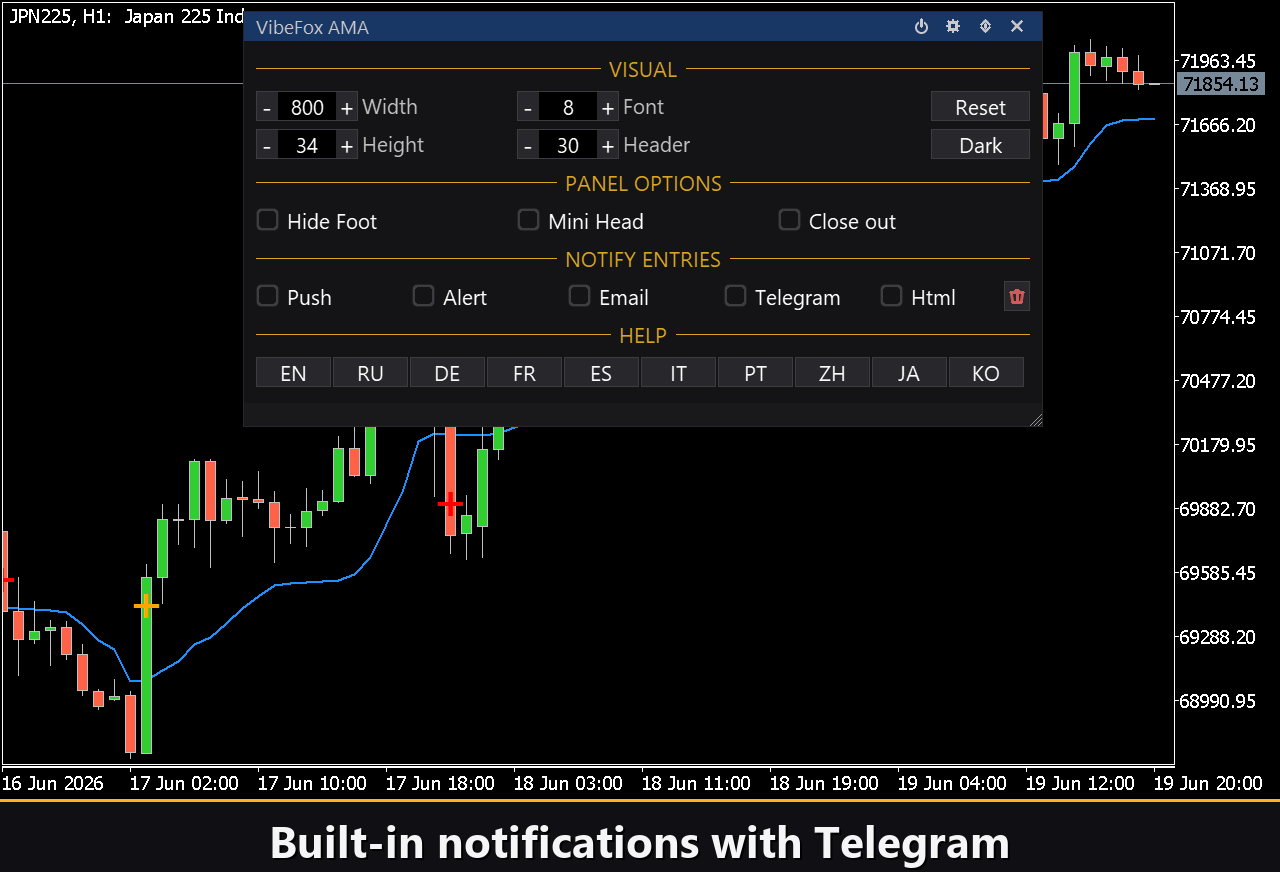
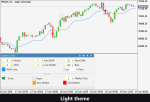
The Settings button opens a section where the panel is fitted to your workspace: a light, dark or automatic Theme, an adjustable panel width, header size, row height and font size. Extra touches let you hide the bottom bar via Hide Footer, shrink the header when collapsed with Mini Header, and automatically collapse the panel on a click outside it. Almost every parameter changes live right on the panel — the input fields on the Inputs tab only set the starting values. You can also run several independent copies on one chart by giving each a unique Instance, to watch different AMA periods and settings side by side.
Entry notifications
You do not need to sit and guard the chart waiting for a signal. Each entry can be sent through several notification channels that are enabled independently right on the panel.
Alert — a pop-up message inside the terminal.
Push — a mobile notification to the MetaTrader app on your phone.
Email — a letter sent through the terminal’s mail settings.
Telegram — the alert text together with a chart screenshot, sent straight to your Telegram chat.
Enable only the channels you need, and you will be notified the moment a new entry appears on the symbol and timeframe you are working with.
Visual history (HTML report)
Enable the Html channel, and every entry signal is saved to an HTML report together with a screenshot of the chart at the moment it fired. The report is stored in the terminal’s Files folder, in the VibeFox_AMA directory, and opens in any browser — you get a visual log of all the entries the indicator found. A one-click trash button clears the report and its screenshots whenever you want to start over.
Telegram Alerts
Signals can also be delivered straight to your Telegram chat — the alert text together with a screenshot of the chart at the moment of detection. Turn on the Telegram channel and enter your bot token and chat id in the inputs.
Delivery rides on the HTML report: each new signal is written into the report, and the report — opened in a browser — forwards it to your Telegram chat on its own. For this reason, enabling Telegram automatically keeps the Html report on, and the two channels work together.
Built-in multilingual help
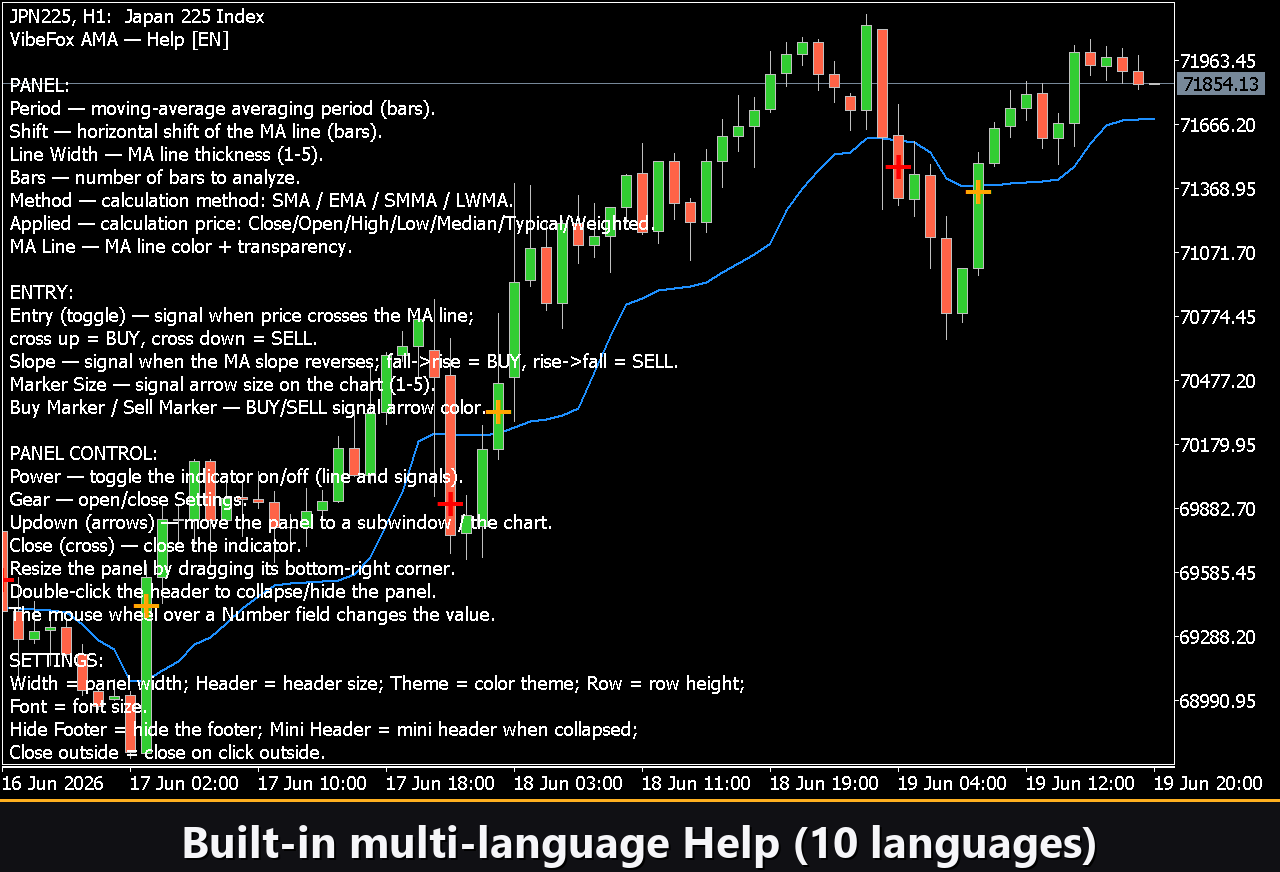
A full help page is built into the panel, available in 10 languages, so every control is explained right where you use it.
Loading...
Loading...