







VibeFox Auto S/R MT5
30,00 €
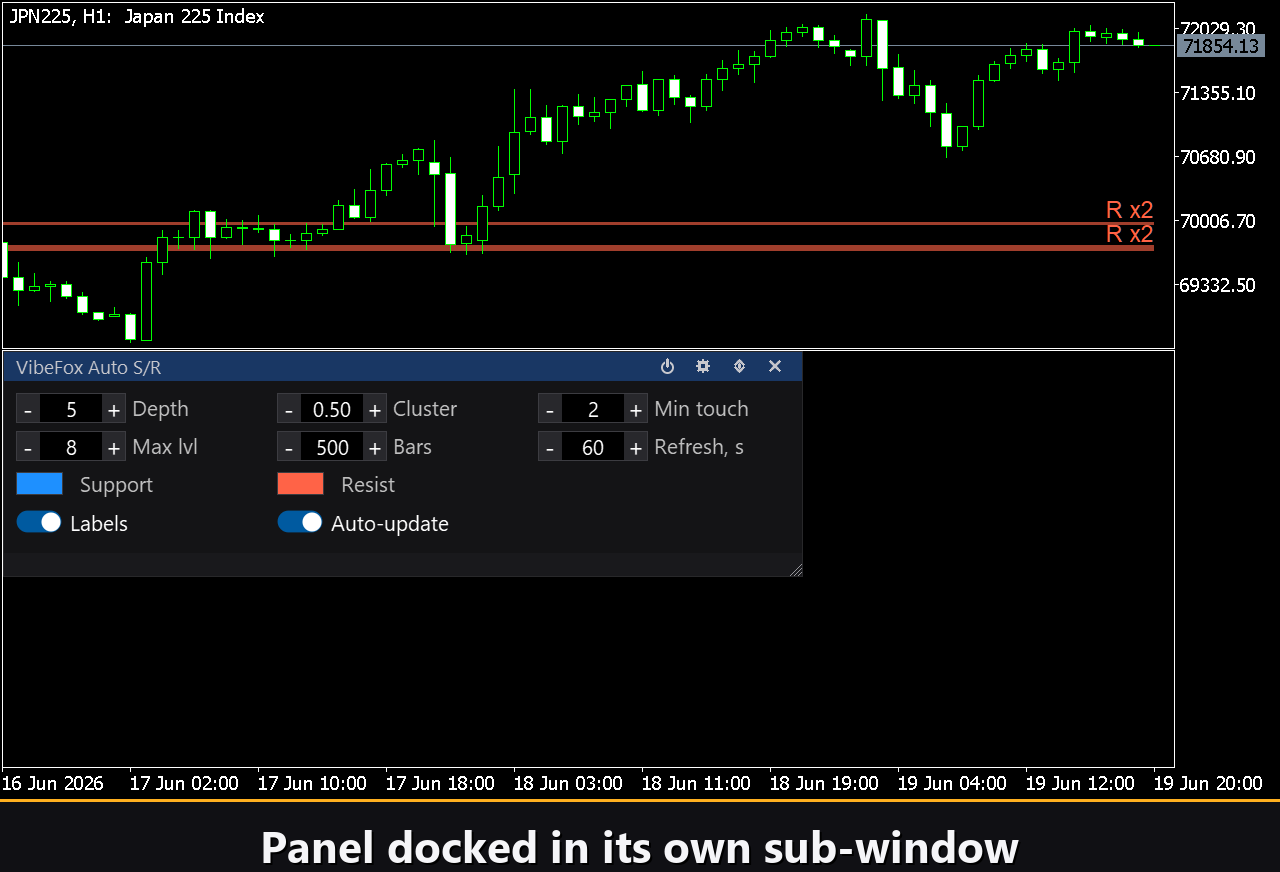
VibeFox Auto S/R is a real-time support and resistance overlay for MetaTrader 5. It scans the selected number of bars, detects swing pivot points, groups them into price zones by ATR-based proximity, ranks each zone by how many times price has touched it, and draws the surviving zones directly on the chart. All detection parameters and visual options are collected in a single modern interactive panel. No manual drawing, no stale levels — the zones update automatically as the market evolves.
VibeFox Auto S/R — automatic support and resistance zones on your chart
VibeFox Auto S/R is a real-time support and resistance overlay for MetaTrader 5. It scans the selected number of bars, detects swing pivot points, groups them into price zones by ATR-based proximity, ranks each zone by how many times price has touched it, and draws the surviving zones directly on the chart. All detection parameters and visual options are collected in a single modern interactive panel. No manual drawing, no stale levels — the zones update automatically as the market evolves.
What support and resistance zones are
Support is a price area where falling price has historically found buying interest and bounced upward. Resistance is a price area where rising price has met selling pressure and reversed downward. Price rarely respects a single exact level; it reacts to a zone — a band around that level where multiple past swings cluster. VibeFox Auto S/R identifies these zones algorithmically so you do not have to hunt for them by eye.
How zones are detected
The algorithm works in three steps. First, it scans the chart for swing pivots: bar is a swing high if its High strictly exceeds the High of every neighbour within the Swing Depth half-window on both sides; a swing low is identified symmetrically on the Low. Swing Depth controls how significant a pivot must be — a value of 5 means the central bar must be the highest (or lowest) across a window of eleven bars.
Second, nearby swing levels are merged by Cluster Tolerance: any two pivot prices that fall within Cluster Tolerance ATR units of each other are grouped into the same zone. The zone’s center is the mean of all members, its boundaries span from the lowest to the highest member, and its touch count equals the number of pivots absorbed. A freshness bonus is added to zones whose most recent member falls within the last 50 bars, so current levels rank above ancient ones.
Third, zones with fewer touches than Min Touches are discarded, and the remaining zones are sorted by strength (touches + freshness bonus). Only the top Max Levels zones are kept and drawn. Swing highs become Resistance zones, swing lows become Support zones.
Bars, Refresh, and Auto Update
Bars controls how many historical bars are scanned for pivots. A larger window finds more pivots and produces denser zones; a smaller window keeps only the most recent price memory. Refresh, s sets the automatic recalculation interval in seconds (0 disables timer-based refresh; zones still update on every new bar). Both Bars and Refresh, s are live controls on the panel — they take effect immediately without restarting the indicator.
Auto Update (an input parameter) determines whether detected zones are refreshed as new bars close. When Auto Update is off, the zones found on the first calculation are frozen and will not change regardless of new bars or the Refresh timer — useful when you want to lock a set of levels for manual analysis.
Visual control
Support zones are drawn in the Support Color (default DodgerBlue) and Resistance zones in the Resistance Color (default Tomato). Each zone is rendered as a horizontal band spanning its price boundaries. When Labels is enabled, a text tag showing the touch count is placed next to each zone, giving you an immediate sense of which levels have the most price memory. Colors can be changed live on the panel.
Interactive on-chart panel
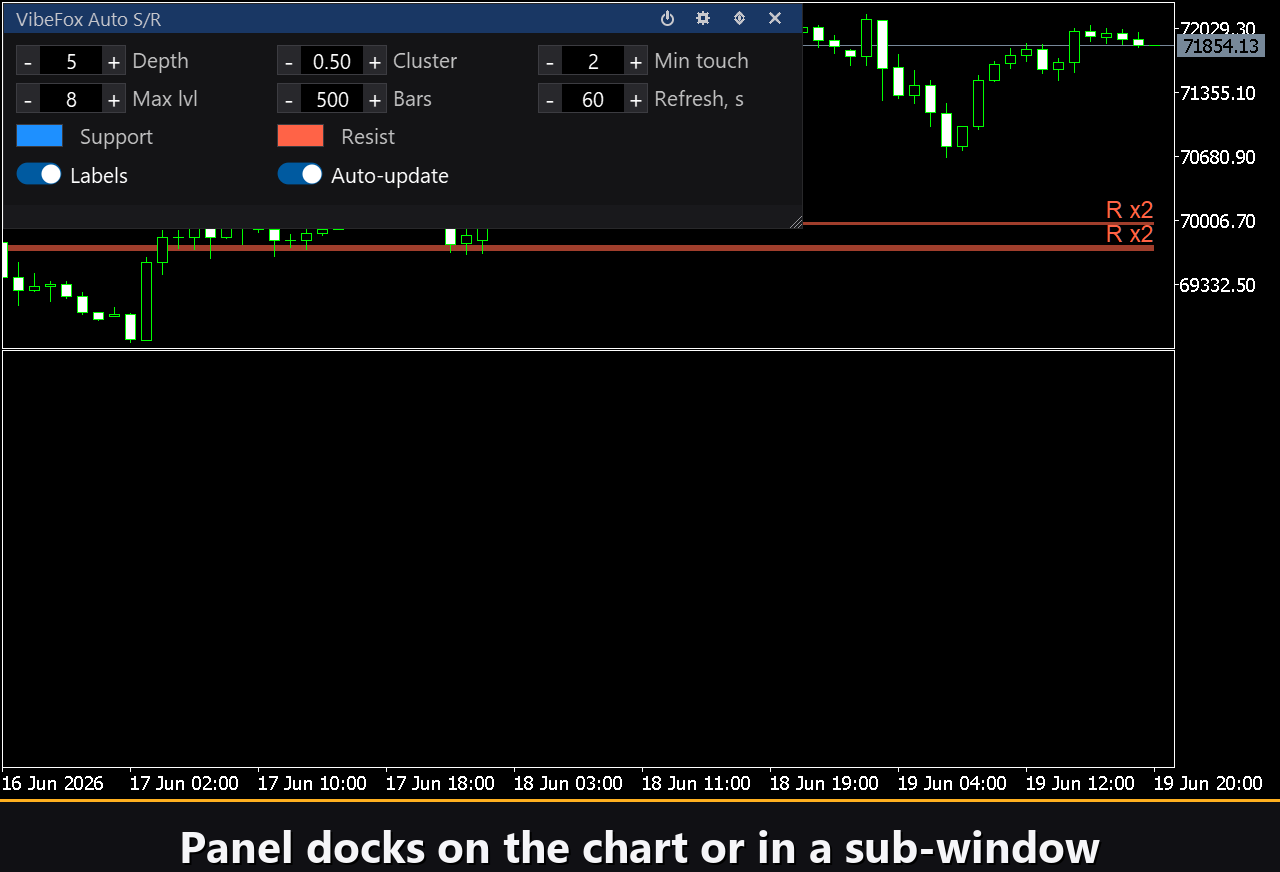
The entire interface is a smooth canvas-based panel designed for fast mouse control. Detection settings, colors, and zone options are arranged in compact rows. The panel header contains control icons.
Power — enables and disables zone drawing without removing the indicator from the chart.
Settings (gear icon) — opens and closes the settings panel.
Updown (arrows) — moves the panel between the subwindow and the main chart.
Close (X) — closes the indicator.
Resizable — drag the bottom-right corner to resize the panel.
Collapsible — double-click the header to collapse the panel into a compact bar.
Mouse wheel — hover over any numeric field and scroll the wheel to change its value without opening the keyboard.
Settings and personalization
The Settings button opens a section where the panel is tuned to your workspace: light, dark, or automatic Theme (follows the chart background), adjustable panel width, header size, row height, and font size. Additional options let you hide the bottom bar with Hide Footer, reduce the header in collapsed state with Mini Header, and auto-collapse the panel on a click outside it. Nearly all parameters change live on the panel — the input fields in the Inputs tab set only the starting values. You can also run several independent copies on the same chart by giving each a unique Instance number, so different parameter sets can be compared side by side.
Built-in multilingual help
A full help page is built into the panel, available in 10 languages, so every control is explained right where you use it.
Loading...
Loading...