


VibeFox SSL MT5
30,00 €
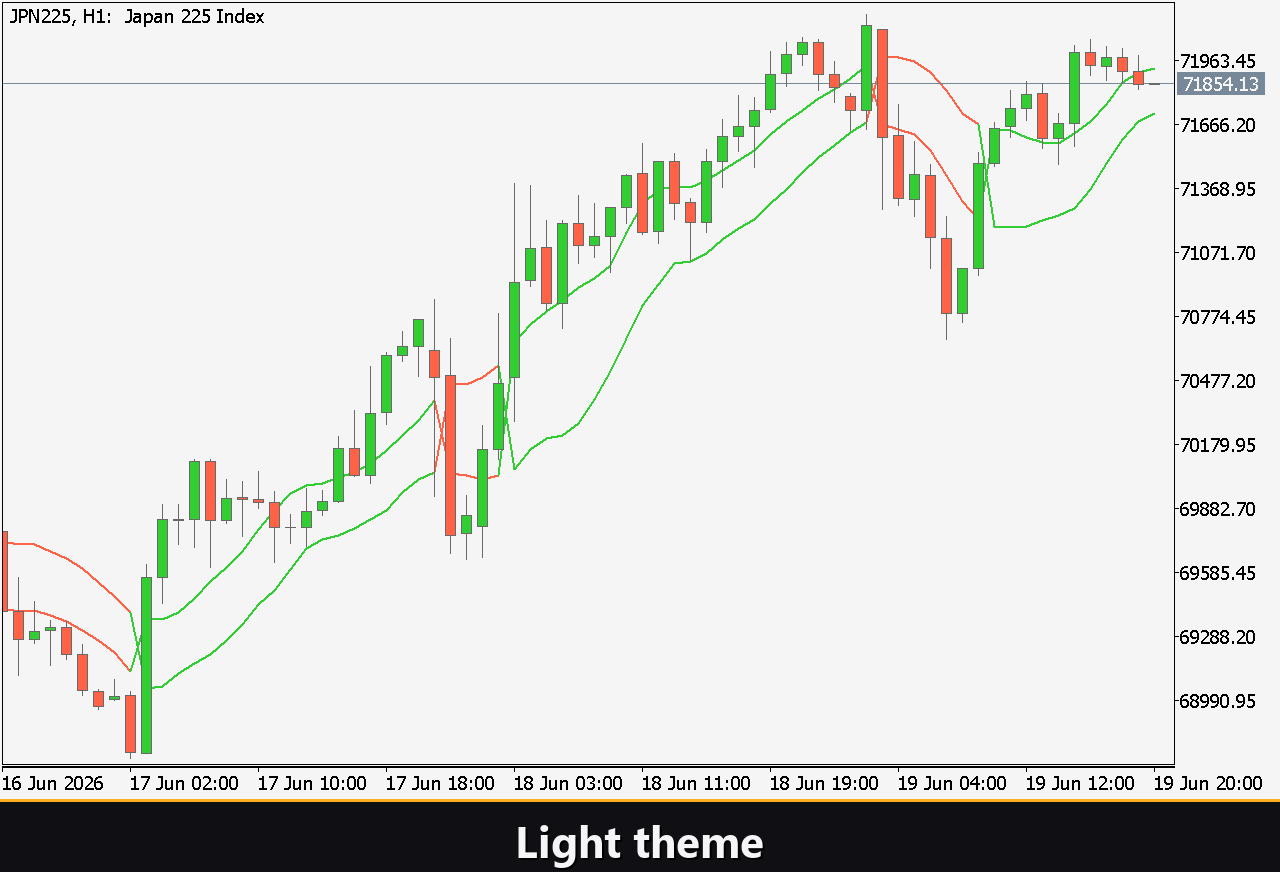
VibeFox SSL is a real-time SSL Channel indicator for MetaTrader 5. It draws two moving-average lines — one on the High, one on the Low — forming a colour-coded channel directly on the price chart. When the channel flips upward the bars are painted with the Up colour; when it flips downward, the Down colour takes over. An optional Hybrid mode adds an EMA baseline to the picture, giving a second filter for trend confirmation and a separate class of entry signals. All parameters are gathered into one interactive canvas panel that stays on the chart while the indicator runs.
VibeFox SSL — SSL Channel and Hybrid Baseline trend overlay
VibeFox SSL is a real-time SSL Channel indicator for MetaTrader 5. It draws two moving-average lines — one on the High, one on the Low — forming a colour-coded channel directly on the price chart. When the channel flips upward the bars are painted with the Up colour; when it flips downward, the Down colour takes over. An optional Hybrid mode adds an EMA baseline to the picture, giving a second filter for trend confirmation and a separate class of entry signals. All parameters are gathered into one interactive canvas panel that stays on the chart while the indicator runs.
What SSL Channel measures
The SSL Channel is built from two moving averages: one applied to the High series and one applied to the Low series, both using the same period and method. The relationship between the two lines defines direction. When sslUp (the High MA) is above sslDown (the Low MA) the channel is bullish; when sslDown crosses above sslUp the channel turns bearish. The flip point is called an SSL Cross and marks the precise bar where the trend changed.
Because the channel spans the High-to-Low range, its width naturally reflects volatility: a wide channel means a fast, volatile move; a narrow one means the market is compressing. The colour fill makes the current state visible at a glance without any manual line comparison.
Hybrid Baseline mode
With Hybrid enabled, a second EMA is computed on the close price and drawn as a baseline across the chart. The baseline acts as a trend filter: a close above the baseline is bullish context; a close below is bearish. The Hybrid mode also unlocks a second signal type, Baseline Exit, which fires whenever the close crosses the baseline — useful as an early exit or a re-entry trigger when the SSL channel has not yet flipped.
Two baseline types are available from the Type selector. EMA is a plain exponential moving average of the close. Keltner uses the Keltner channel midline, which is also EMA-based but responds slightly differently to price swings. Both options share the same Base period input.
Entry points
Two independent signal types are available, each with its own toggle in the ENTRY block of the panel. Entry markers appear as arrows on the price chart at the bar where the condition fired.
SSL Cross
The primary signal fires on a flip of the SSL channel direction. When sslUp crosses above sslDown — the channel turns bullish — a BUY arrow is placed below the bar. When sslDown crosses above sslUp — the channel turns bearish — a SELL arrow is placed above the bar. This is the classical SSL Cross signal and works on any timeframe without any additional filter.
Baseline Exit
The secondary signal is available only when Hybrid is enabled. It fires when the close price crosses the EMA baseline: a close moving above the baseline generates a BUY marker; a close moving below generates a SELL marker. This signal is designed as a complement to the SSL Cross — it catches situations where price rotates back through the baseline before the channel itself has time to flip, giving an earlier warning of a possible reversal or a re-entry opportunity inside an established trend.
Marker colours are set separately for BUY and SELL via the Buy and Sell colour pickers, and the Size control scales all markers from 1 to 5 to match any chart density.
Full visual control
Every visual element is adjustable. The Up and Down colour pickers set the colour of each channel line independently, with a transparency slider built into the picker so you can fade a line without changing its hue. Width sets the line thickness in pixels from 1 to 10, and Style switches between Solid, Dash, Dot, DashDot and DashDotDot. The Bars number controls how many historical bars the channel is drawn over, and Refresh, s sets an automatic redraw interval in seconds for symbols that do not produce a steady tick stream.
Interactive on-chart panel
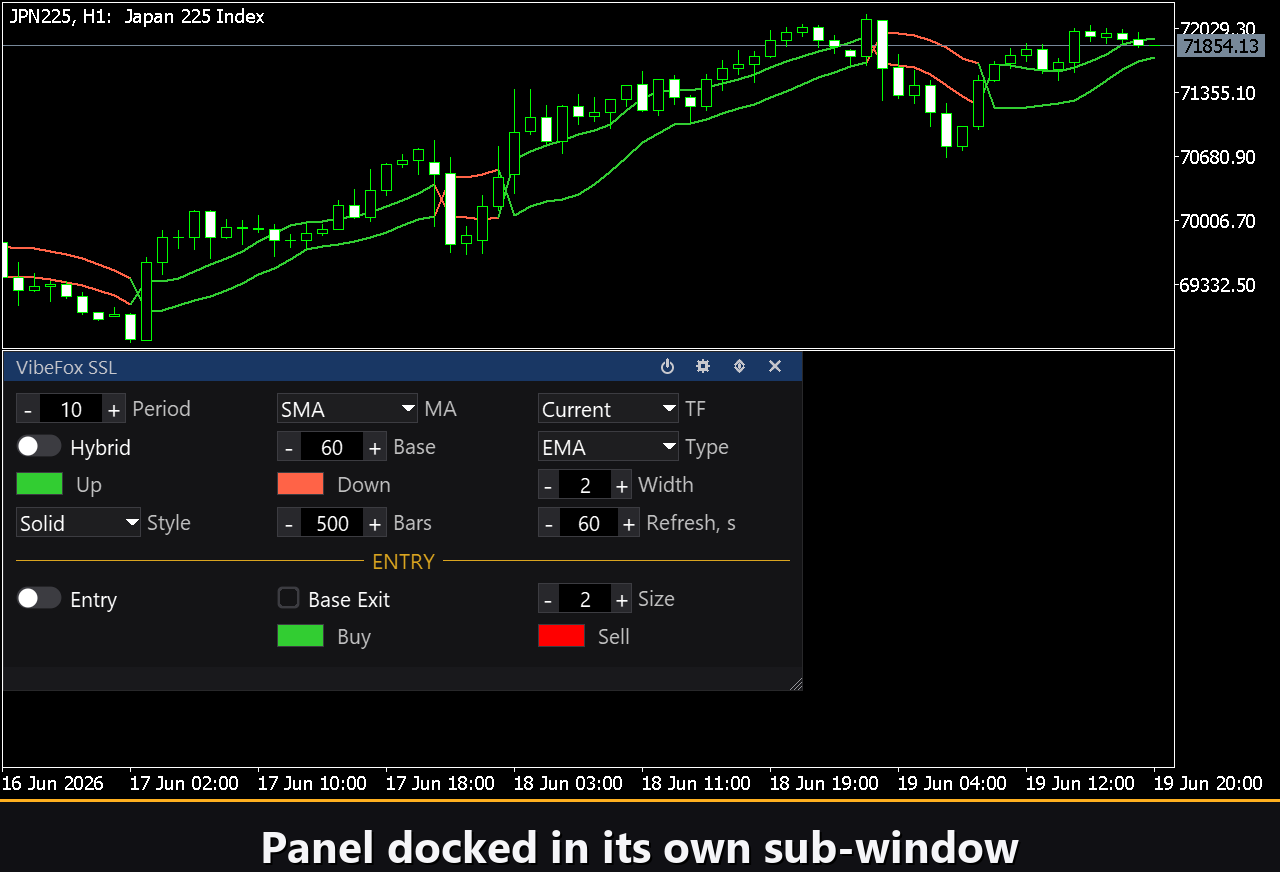
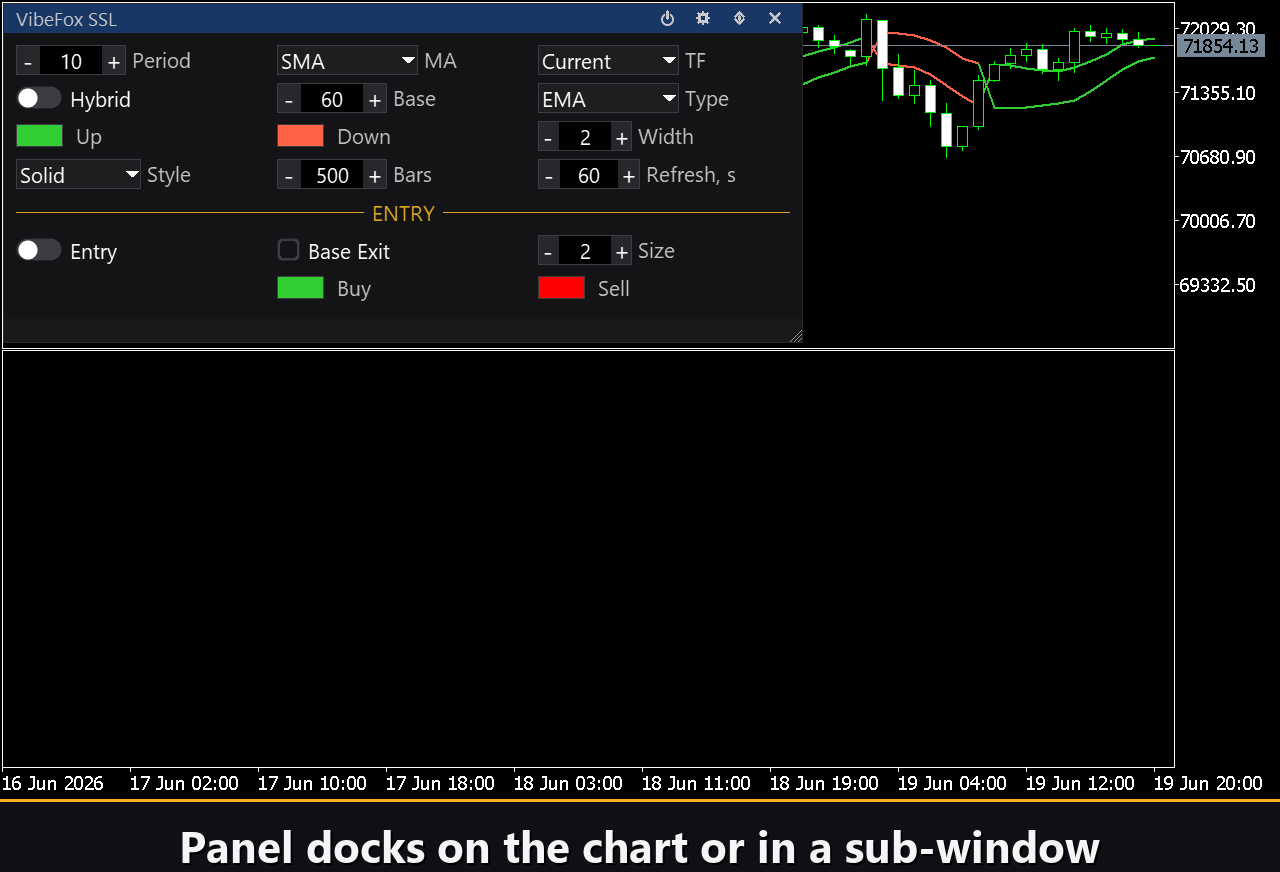
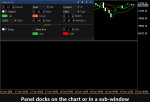
The entire interface lives in a single canvas panel that floats on the chart. All controls are in tidy three-column rows, and the entry block is set apart with a gold ENTRY heading so signal settings do not get mixed up with channel settings. The header holds four control icons.
Power — turns drawing of the SSL channel and all entry markers on and off without removing the indicator from the chart.
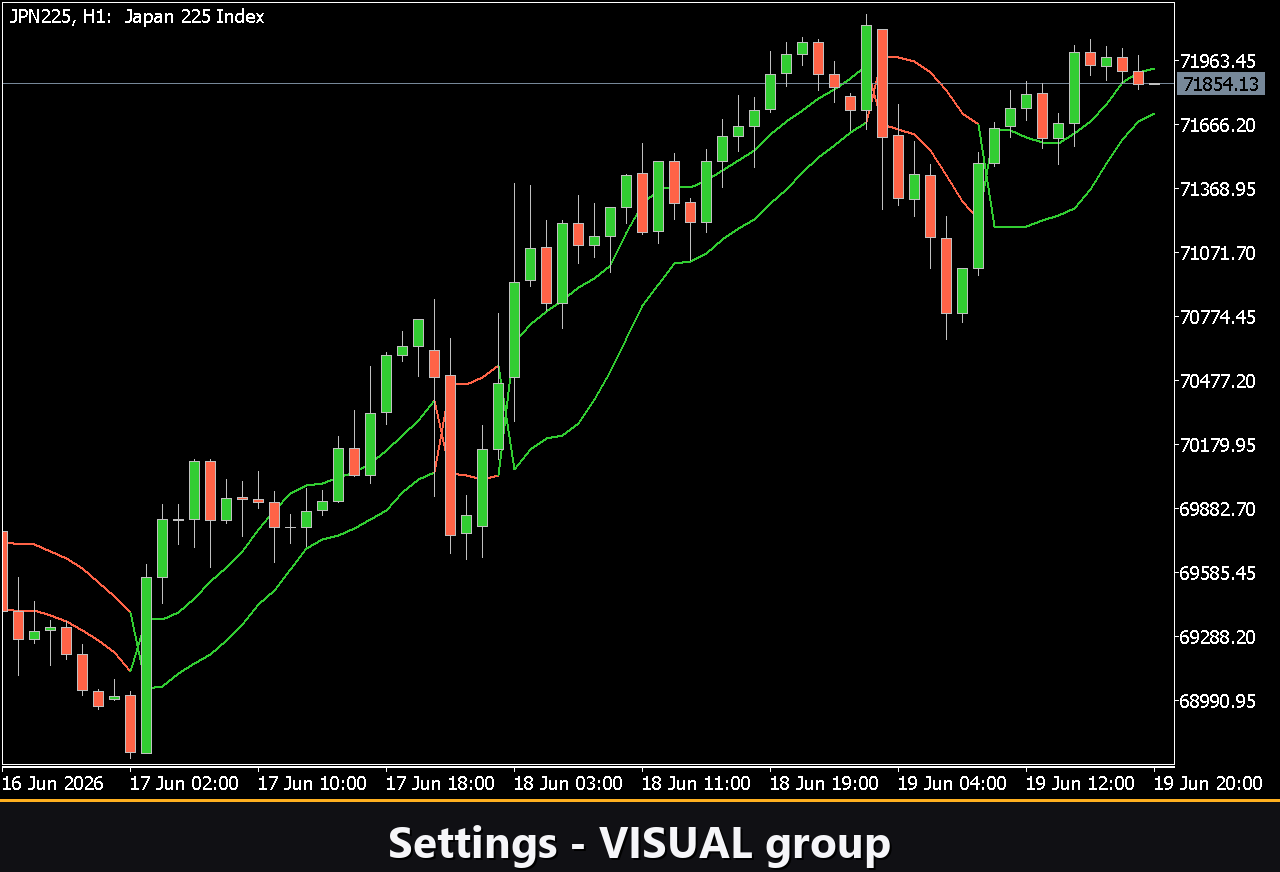
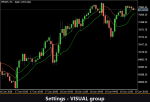
Settings (gear) — opens and closes the built-in settings section where panel appearance is configured.
Updown (arrows) — moves the panel between a separate subwindow and the main price chart.
Close (cross) — removes the indicator from the chart.
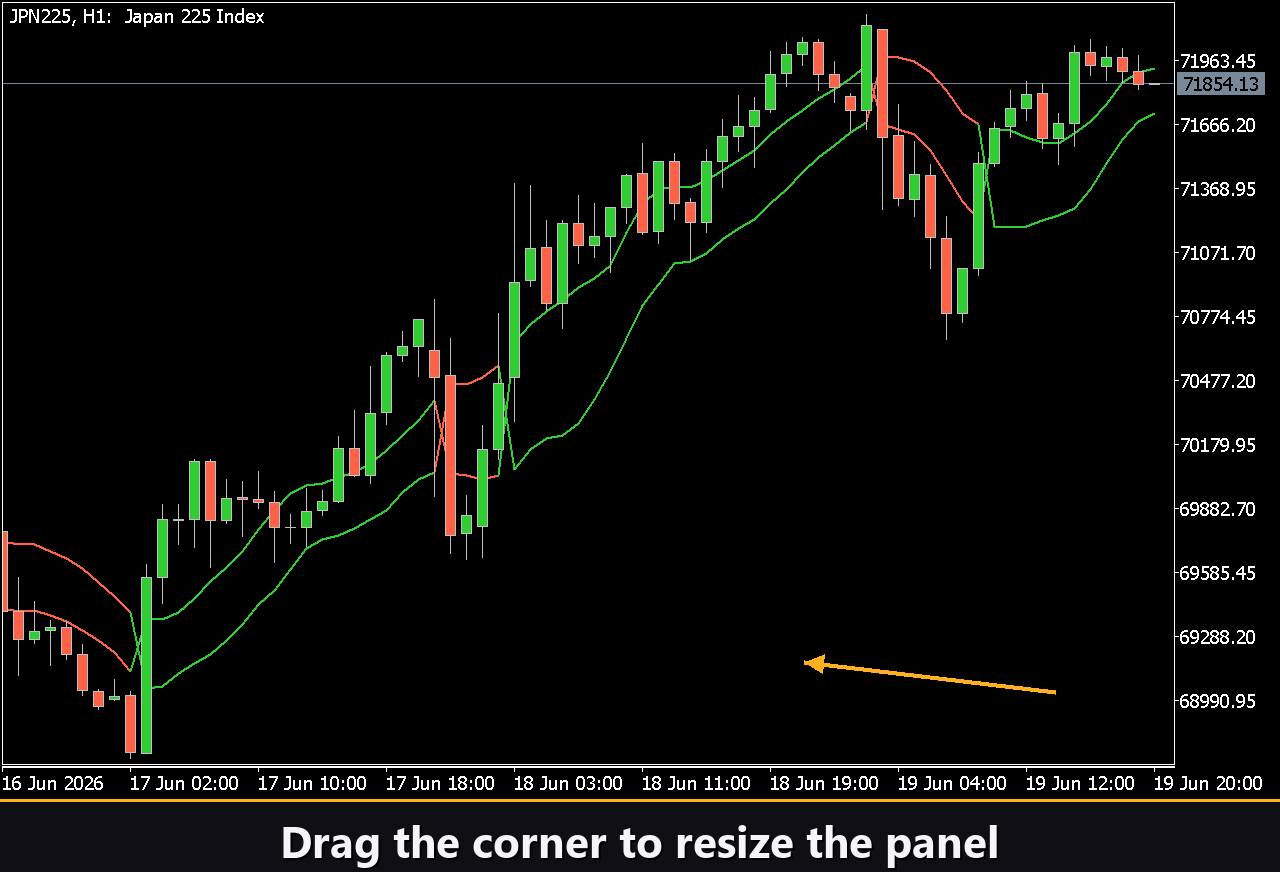
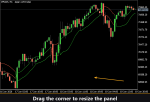
Resizable — drag the bottom-right corner to scale the panel to any size.
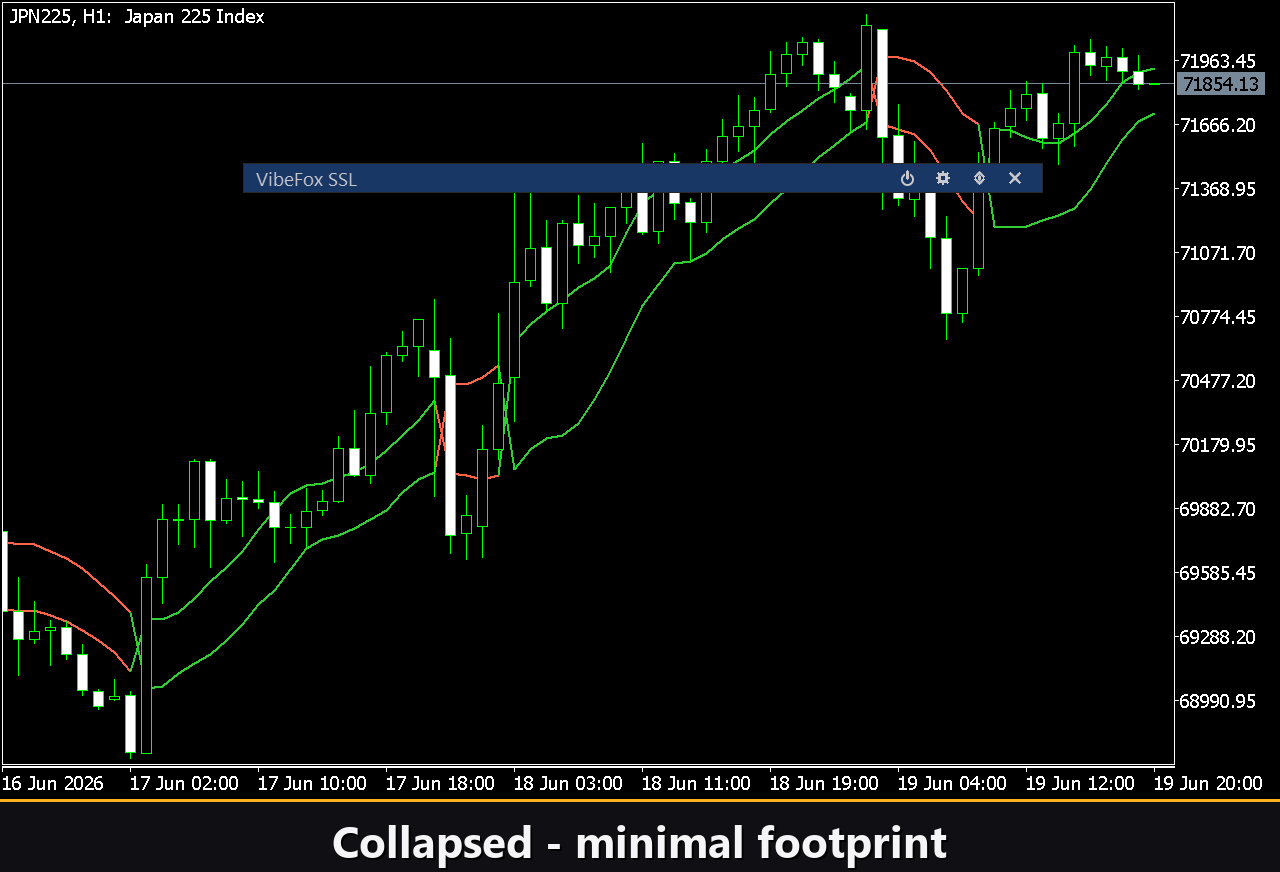
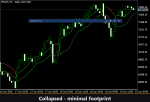
Collapsible — a double-click on the header collapses the panel into a compact strip; another double-click restores it.
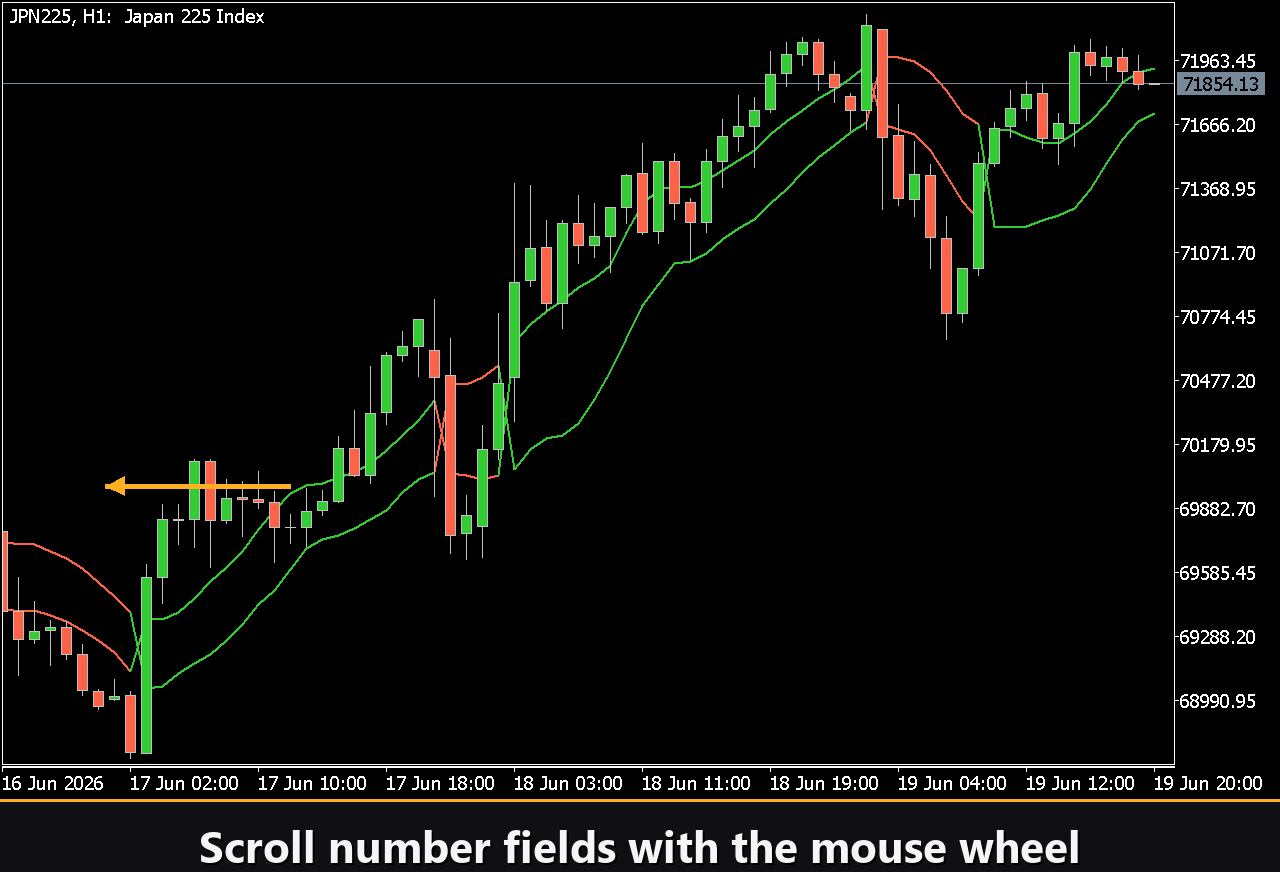
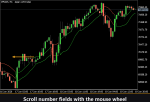
Mouse wheel — hover over any numeric field such as Period, Base or Size and scroll the wheel to increment or decrement the value without opening the keyboard.
Settings and personalization
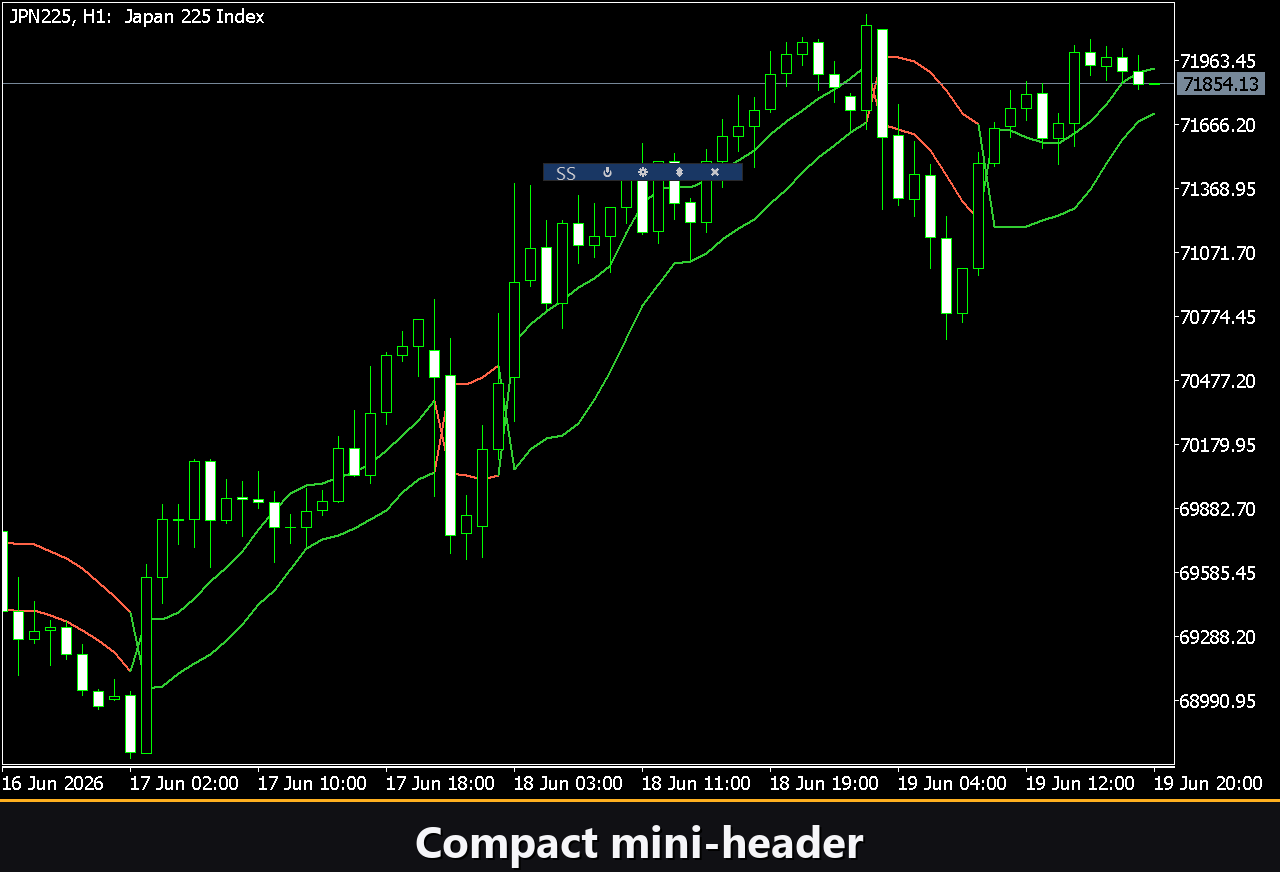
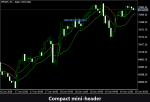
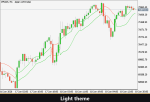
The Settings button opens a section where the panel fits your workspace. Choose a light, dark or automatic Theme that follows the chart background. Adjust the panel width, header size, row height and font size to your screen density. Hide Footer removes the bottom status bar when you need every pixel. Mini Header shrinks the header strip when the panel is collapsed. Close on click outside collapses the panel the moment you click anywhere on the chart outside it. The Instance input lets you run several independent copies of the indicator on one chart — each with its own period, baseline and signal settings — by giving each a unique number.
Entry notifications
You do not need to watch the chart for a signal. Each entry can be forwarded through several notification channels that are enabled independently on the panel.
Alert — a pop-up message inside the terminal at the moment the signal fires.
Push — a mobile notification to the MetaTrader app on your phone.
Email — a letter sent through the terminal’s configured mail account.
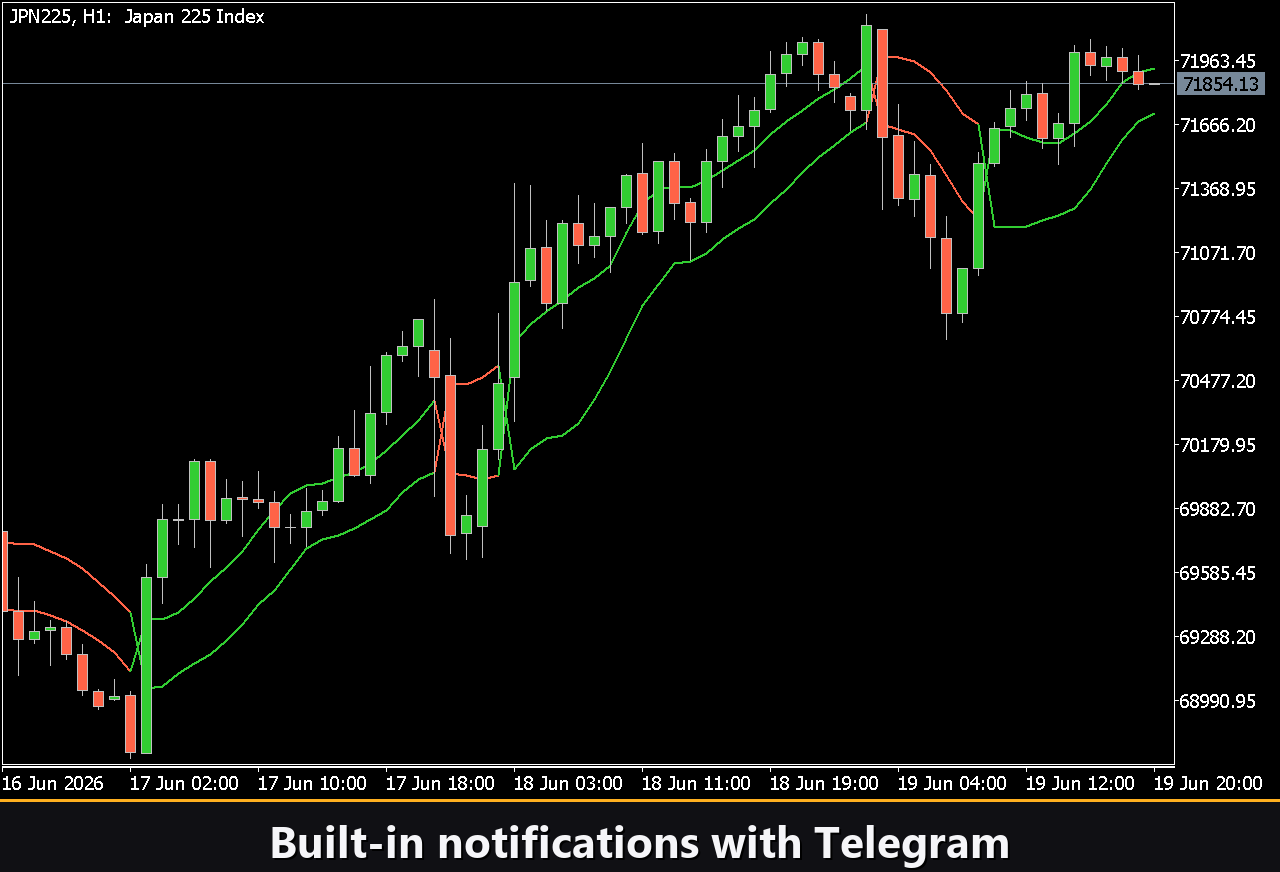
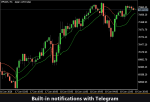
Telegram — the signal text together with a chart screenshot, sent straight to your Telegram chat. Enabling Telegram automatically keeps the Html channel active, because delivery rides on the HTML report opened in a browser.
Visual history (HTML report)
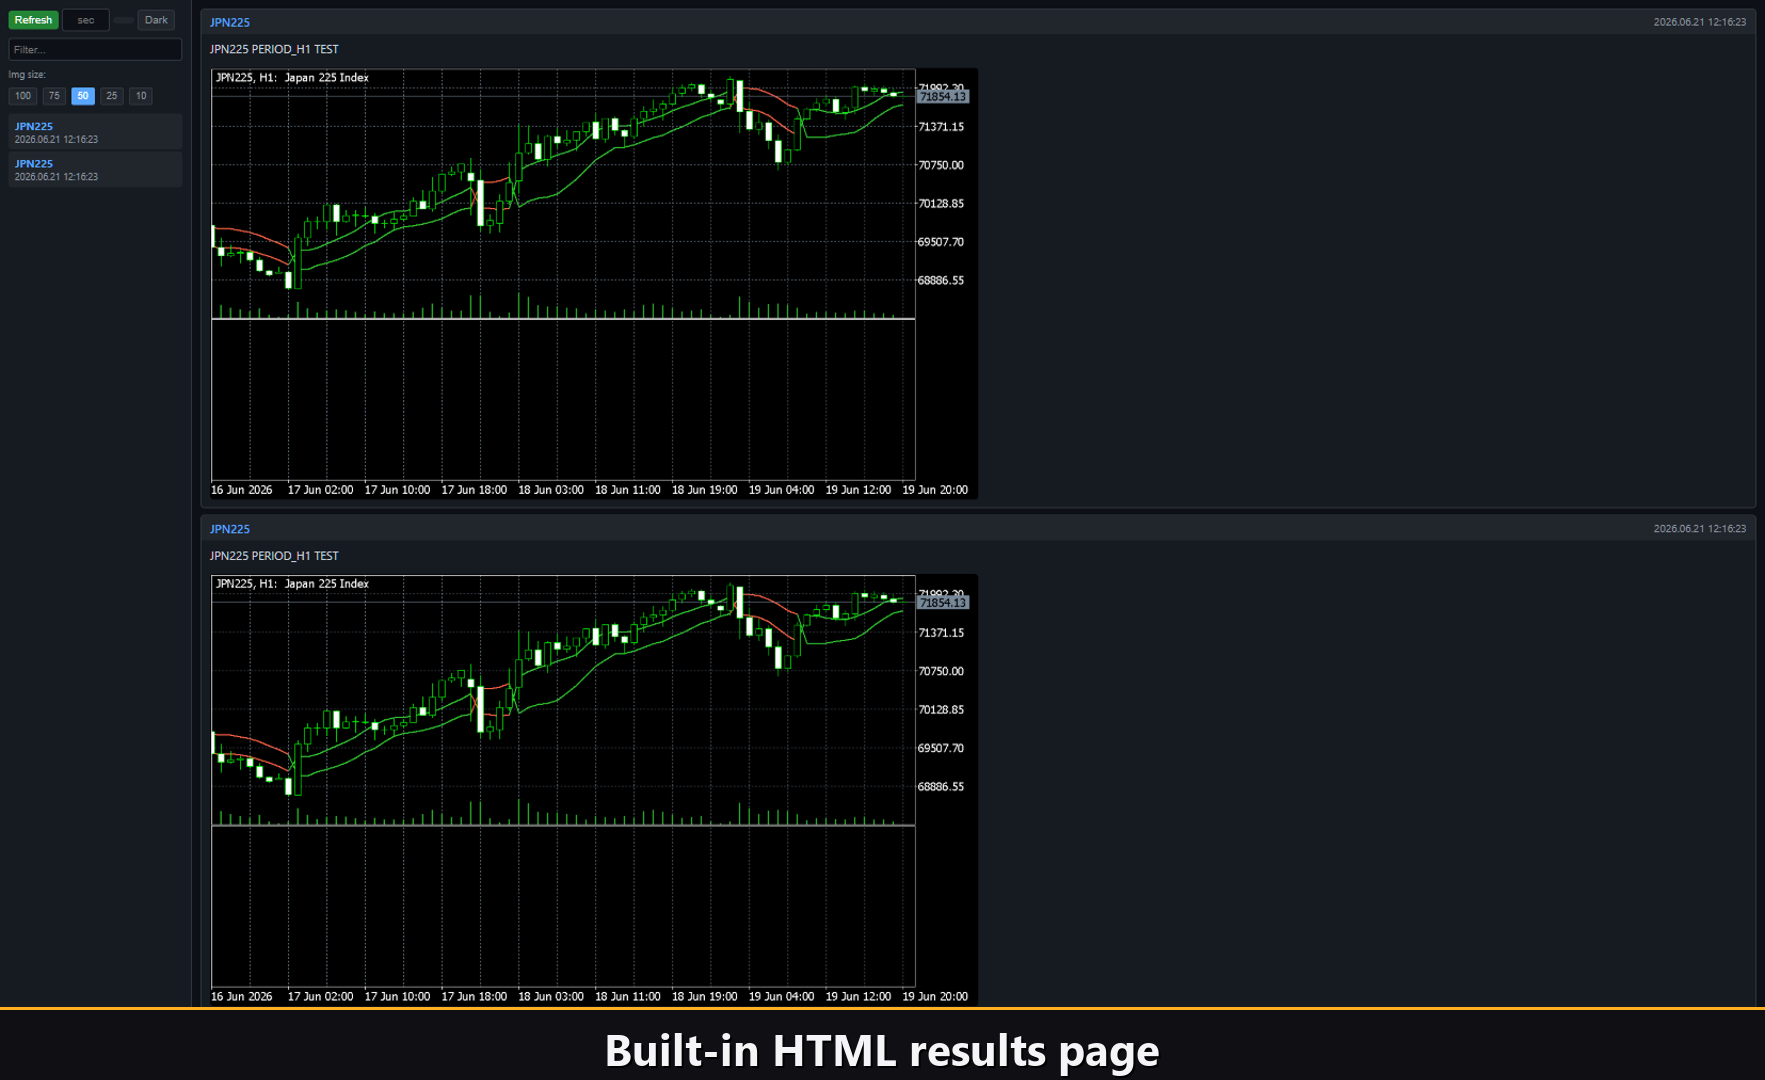
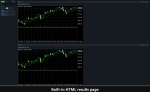
Enable the Html channel and every entry signal — SSL Cross or Baseline Exit — is saved to an HTML report together with a screenshot of the chart taken at the moment it fired. The report is stored in the terminal Files folder at MQL5/Files/VibeFox_SSL/result.html and opens in any browser, giving you a scrollable visual log of every entry the indicator has detected. The trash button on the panel clears the report and its screenshots whenever you want to start a fresh log.
Built-in multilingual help
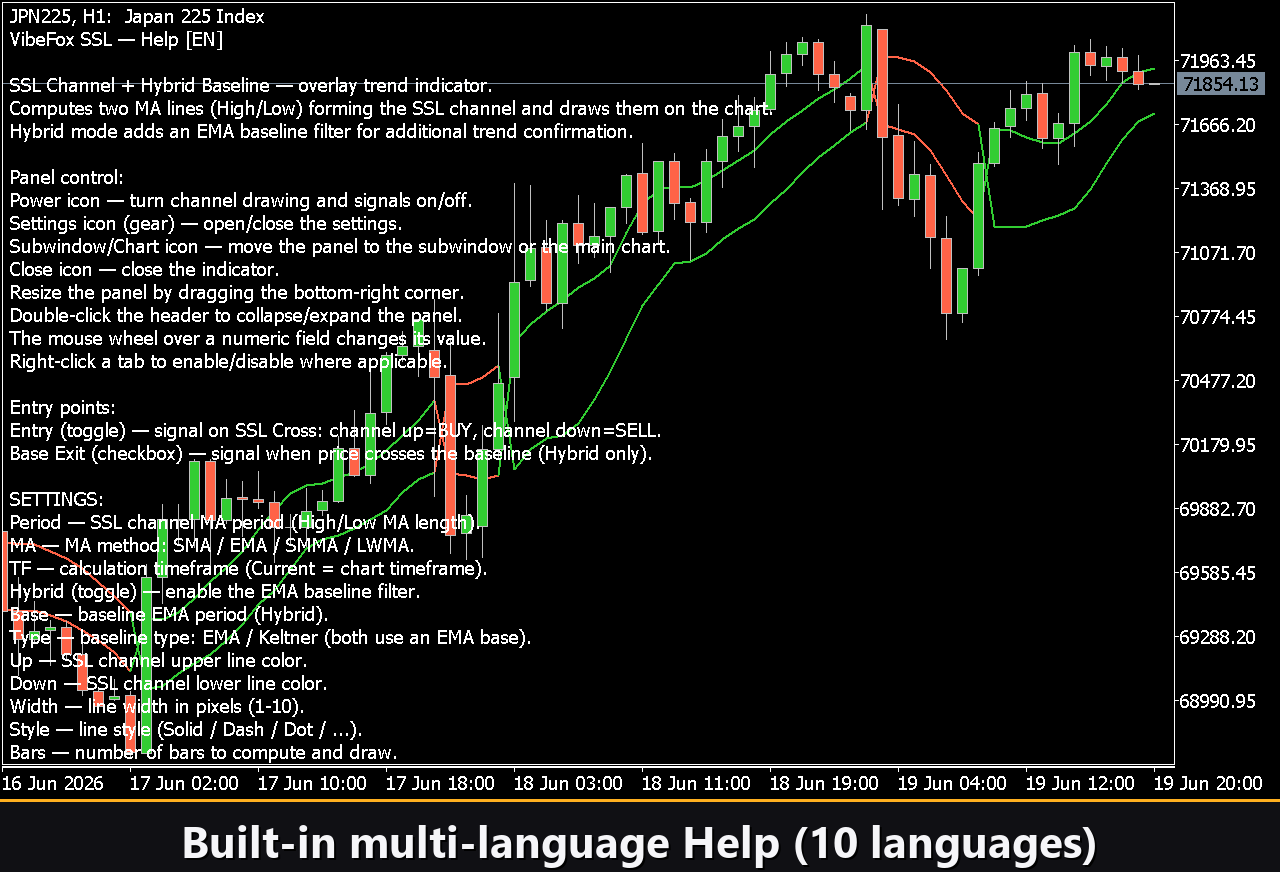
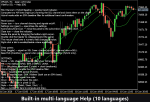
A complete help page is built into the Settings section and is available in 10 languages. Click the language button to display the full description of every control as a chart overlay — no need to open an external manual.
Loading...
Loading...