













VibeFox RSI MT5
30,00 €
VibeFox RSI is a full-featured Relative Strength Index indicator for MetaTrader 5. It plots the classic RSI line in a dedicated subwindow with adjustable Overbought and Oversold levels, detects two independent entry-signal types, marks them as coloured arrows directly on the price chart, and brings every control into one modern canvas-based interactive panel. Instead of reading raw numbers and guessing whether a level has been crossed, you see the moment the condition forms — and optionally get notified without staying glued to the screen.
VibeFox RSI — momentum clarity, entry signals, and real-time panel control
VibeFox RSI is a full-featured Relative Strength Index indicator for MetaTrader 5. It plots the classic RSI line in a dedicated subwindow with adjustable Overbought and Oversold levels, detects two independent entry-signal types, marks them as coloured arrows directly on the price chart, and brings every control into one modern canvas-based interactive panel. Instead of reading raw numbers and guessing whether a level has been crossed, you see the moment the condition forms — and optionally get notified without staying glued to the screen.
What RSI measures
The Relative Strength Index, developed by J. Welles Wilder, compresses price momentum into a scale of 0 to 100. It compares the average size of recent up-moves to the average size of recent down-moves over a lookback window. When buyers have dominated for the past Period bars the line climbs toward 100; when sellers have been in control it falls toward 0. The most useful reading comes at the extremes: when RSI rises above the Overbought level (default 70) the market has been gaining unusually fast and may be stretched; when it falls below the Oversold level (default 30) the opposite is true.
Three dashed horizontal lines are always drawn in the subwindow — at the Overbought level, at 50, and at the Oversold level — so you can read the context of the line at a glance without having to remember the thresholds. The 0-to-100 scale is fixed, so the visual proportions stay consistent across all timeframes and symbols.
Overbought and Oversold levels
The Overbought and Oversold levels are fully configurable. The defaults of 70 and 30 are the most widely used settings, but on strongly trending instruments many traders shift them to 80/20 to catch only the sharpest extremes, or tighten to 65/35 to respond more often. Both parameters can be changed live on the panel without reloading the indicator, and the dashed level lines update instantly to reflect the new positions.
Entry points
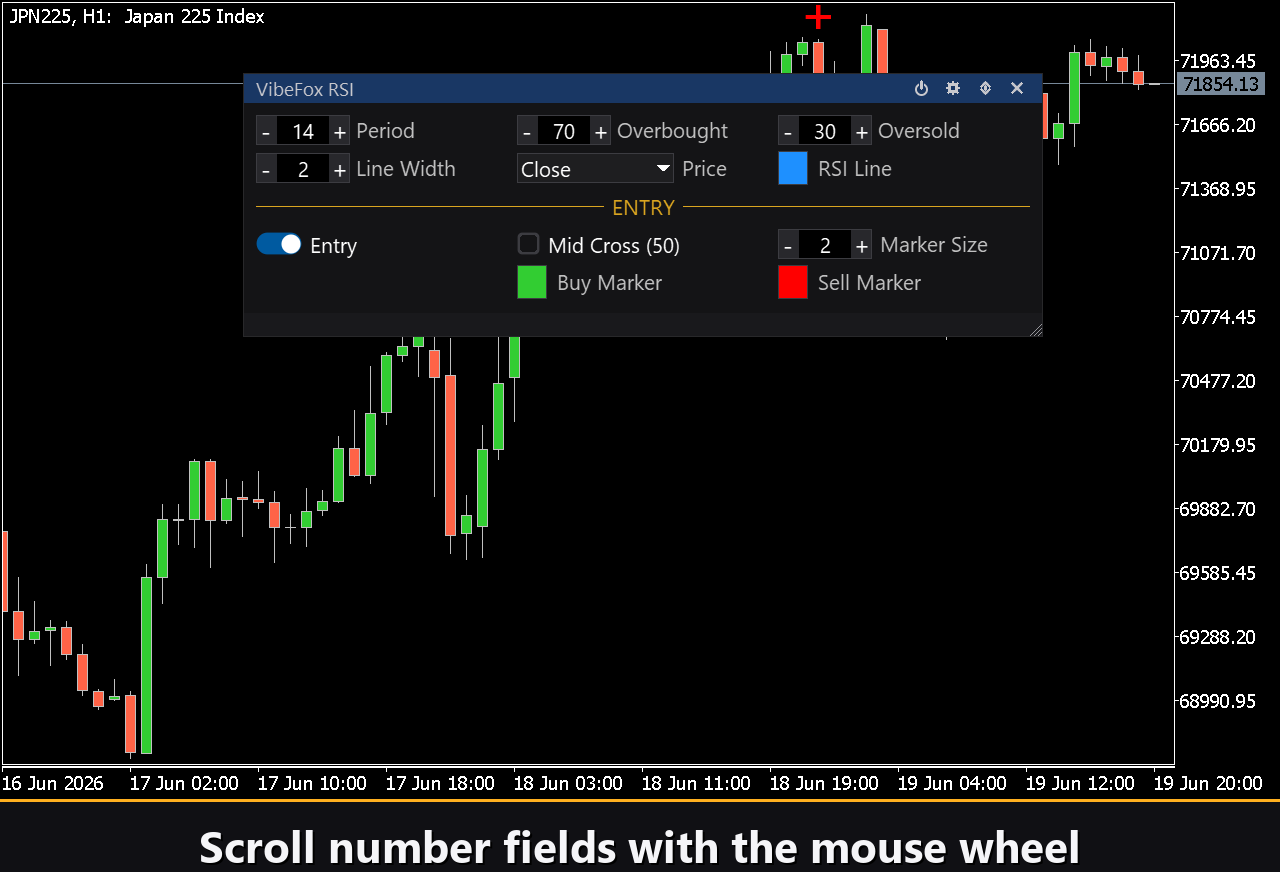
VibeFox RSI detects two independent entry conditions. Each has its own toggle, so you can enable either one alone, both together, or neither — in which case the indicator works purely as a visual oscillator without markers. Entry arrows appear on the price chart (not in the subwindow), exactly on the bar where the condition formed.
Entry — OB/OS Exit
The primary signal fires when RSI exits an extreme zone rather than entering it. The logic is intentional: entering an extreme zone can mean the trend is still accelerating, but the moment RSI turns back and crosses the threshold on the way out, momentum has already exhausted and a reversal is underway. When RSI rises back above the Oversold level a BUY arrow is placed on the chart; when it falls back below the Overbought level a SELL arrow is placed. This filter waits for confirmation instead of guessing the exact bottom or top.
Mid Cross — 50-line crossover
The second signal watches the midpoint of the RSI scale. When RSI crosses the 50 level from below, buyers have taken control of the lookback window and a BUY arrow appears. When it crosses from above, sellers have taken over and a SELL arrow appears. The 50-line crossover is a trend-following signal — useful as a confirmation tool or as a standalone filter to stay on the right side of momentum. Enable Mid Cross in the Entry section of the panel to activate it.
Both arrow types share the same size control (Marker Size, 1 to 5) but have their own independent colour and transparency pickers, so BUY and SELL entries are always visually distinct no matter how many signals appear on a busy chart.
Full visual control
The RSI line itself is fully customisable. The RSI Line Color picker lets you choose any colour, and the RSI Line Transparency slider (0 = fully opaque, 100 = invisible) lets you fade it into the background if you want the entry arrows to be the focus. Line Width (1 to 5 pixels) scales the line for any screen density, from a packed intraday minute chart to a sparse weekly chart. The Applied Price selector lets you calculate RSI on Close, Open, High, Low, Median, Typical, or Weighted price — change it live on the panel and the entire RSI history recalculates instantly.
Interactive on-chart panel
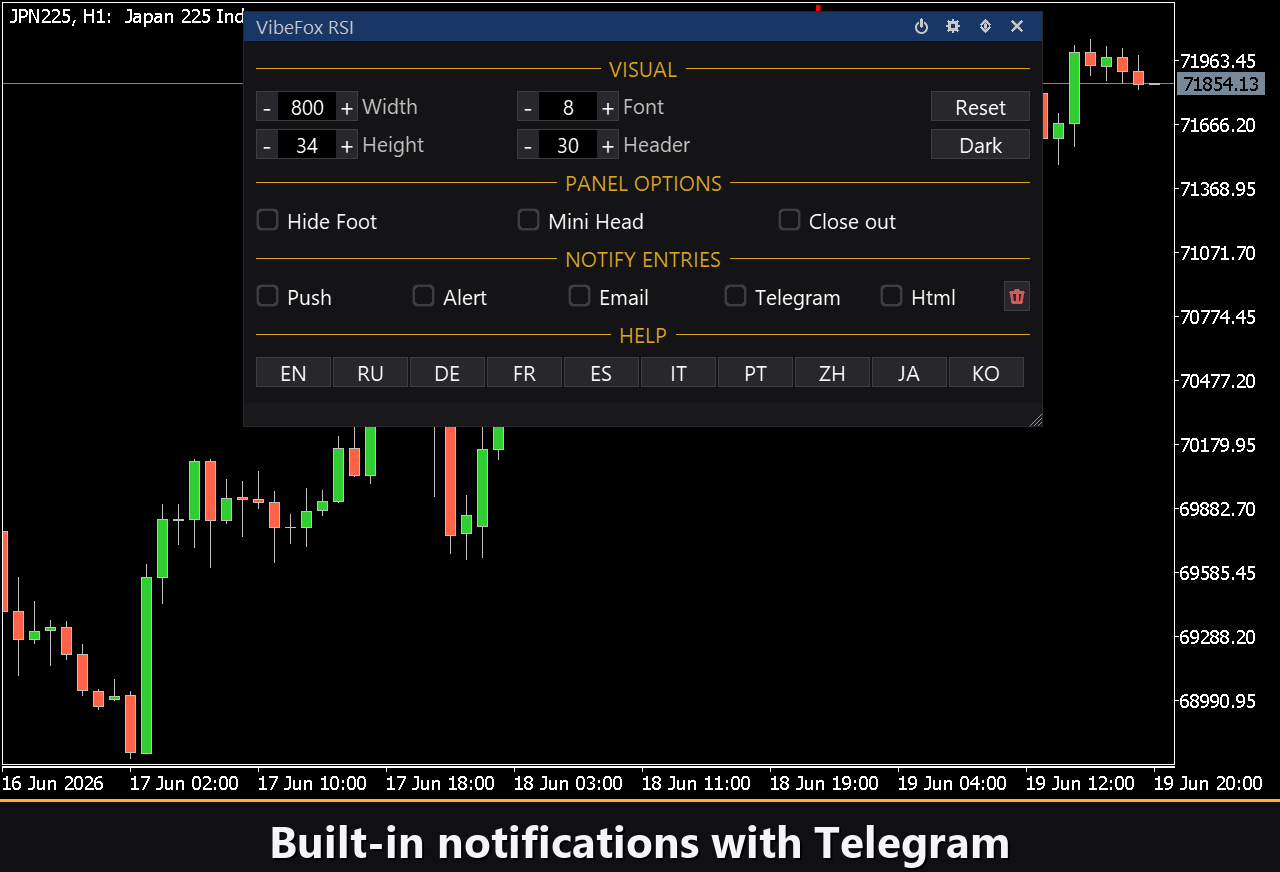
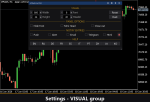
The entire interface is a smooth canvas panel designed for fast mouse-driven control. Parameters are arranged in tidy multi-column rows, and the entry settings are separated from the line settings so nothing is cluttered. The header bar holds the main control icons.
Power — toggles the RSI line and all signals on and off without removing the indicator from the chart.
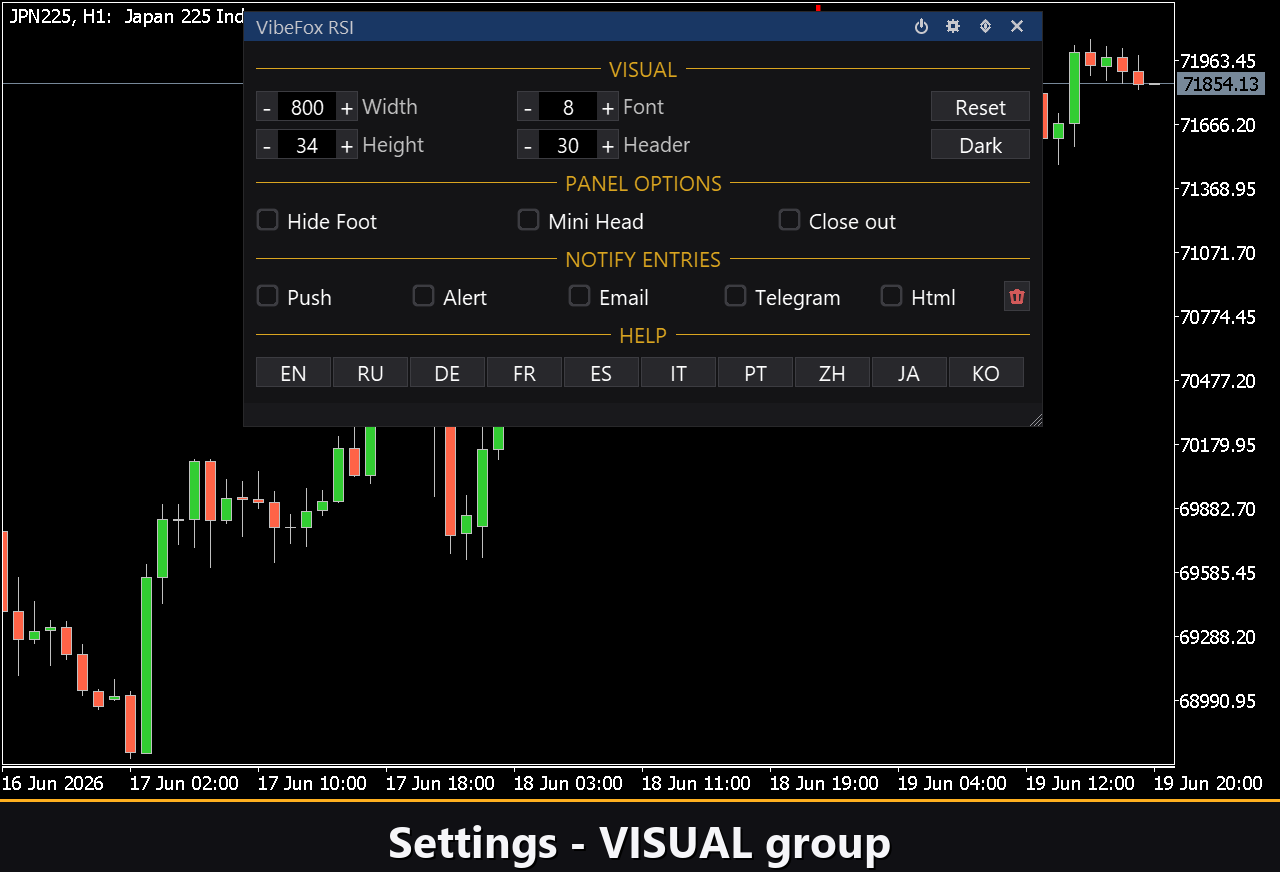
Settings (gear icon) — opens and closes the Settings section where the panel itself is configured.
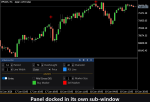
Updown (arrows) — moves the panel between the subwindow and the main chart with a single click.
Close (cross) — removes the indicator from the chart.
Resizable — drag the bottom-right corner to scale the panel to any size that fits your workspace.
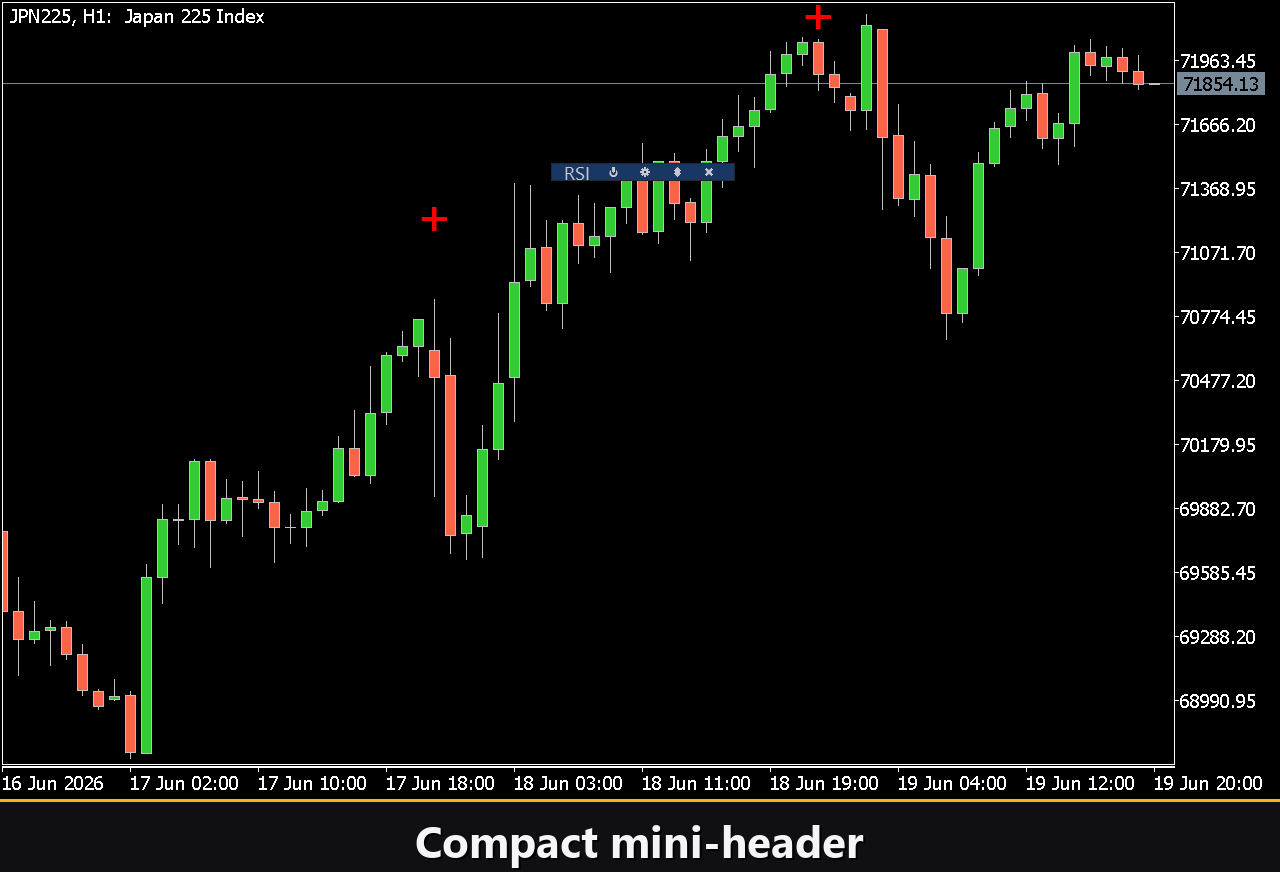
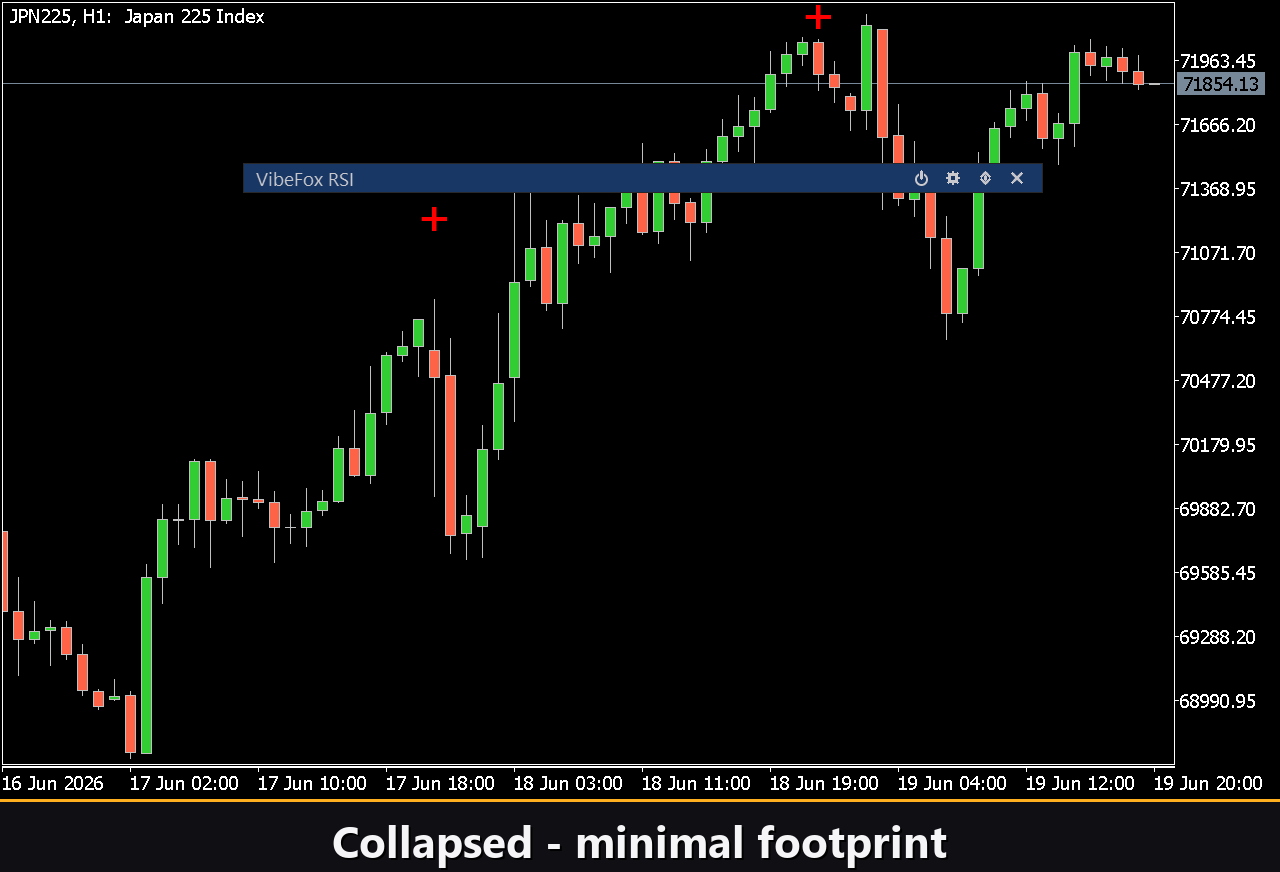
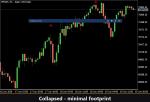
Collapsible — double-click the header to collapse the panel to a compact title bar, freeing screen space while keeping the indicator active.
Mouse wheel — hover over any numeric field and scroll the wheel to increment or decrement the value without touching the keyboard.
Settings and personalisation
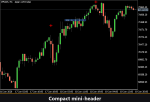
The Settings button opens a section that adapts the panel to your workspace. Choose between a dark, light, or automatic Theme that follows the chart background colour. Set the panel width (300 to 800 px), the header bar size, the row height and the font size to suit your screen resolution and personal taste. Extra refinements include Hide Footer to remove the status bar, Mini Header to keep a compact title when collapsed, and Close on click outside to auto-collapse the panel when you click elsewhere on the chart. Nearly every parameter can be changed live — the Inputs tab values are only the starting point when the indicator first loads. Run multiple independent copies on the same chart by assigning each a unique Instance number, and choose whether the panel opens in the Subwindow or on the main chart by default with Panel Start Window.
Notifications
You do not need to watch the chart to catch a signal. Each entry can be broadcast through up to three independent notification channels, toggled directly in the panel.
Alert — a pop-up message inside MetaTrader 5, on the terminal where the indicator runs.
Push — a mobile push notification delivered to the MetaTrader app on your phone or tablet.
Email — an email sent through the mail settings configured in the terminal.
Telegram — the alert text together with a chart screenshot, sent straight to your Telegram chat.
Turn on only the channels you need. Notifications fire once per bar, on the first closed bar where the condition is detected, so you never receive duplicates.
Visual history — Html report
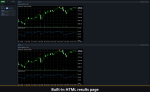
Enable the Html channel and every entry signal is saved together with a screenshot of the chart at the moment it fired. The report is stored in the terminal’s Files folder under VibeFox_RSI as result.html and can be opened in any browser — a visual journal of every entry the indicator found. The trash-can button inside the Settings section clears the report and its screenshots folder in a single click whenever you want to start fresh.
Telegram Alerts
Signals can also be delivered straight to your Telegram chat — the alert text together with a screenshot of the chart at the moment of detection. Turn on the Telegram channel and enter your bot token and chat id in the inputs.
Delivery rides on the HTML report: each new signal is written into the report, and the report — opened in a browser — forwards it to your Telegram chat on its own. For this reason, enabling Telegram automatically keeps the Html report on, and the two channels work together.
Built-in multilingual help
A full help page is built into the panel, available in 10 languages, so every control is explained right where you use it — no need to consult external documentation for day-to-day operation.
Loading...
Loading...