

VibeFox MFI MT5
VibeFox MFI is a real-time Money Flow Index indicator for MetaTrader 5. It plots the classic MFI oscillator line in a separate subwindow, marks the moment an entry signal appears right on the price chart, and gathers all the controls into one modern interactive panel. Instead of manually watching the oscillator drift in and out of extreme zones, you see the overbought and oversold conditions and the entry point at the very moment they form.
VibeFox MFI — Money Flow Index with entry points
VibeFox MFI is a real-time Money Flow Index indicator for MetaTrader 5. It plots the classic MFI oscillator line in a separate subwindow, marks the moment an entry signal appears right on the price chart, and gathers all the controls into one modern interactive panel. Instead of manually watching the oscillator drift in and out of extreme zones, you see the overbought and oversold conditions and the entry point at the very moment they form.
What MFI measures
The Money Flow Index is a volume-weighted momentum oscillator that combines price movement and volume to gauge buying and selling pressure. It answers a question that pure price oscillators cannot: whether the money behind a move is actually flowing in or out. The MFI ranges from 0 to 100, with readings above the Overbought Level suggesting excessive buying pressure and readings below the Oversold Level suggesting excessive selling pressure.
It reads at a glance. When the MFI line rises above the overbought threshold the market is absorbing a disproportionate amount of buying volume; when it falls below the oversold threshold selling dominates. The neutral 50 mid-line divides bullish money flow from bearish, and a cross of that line is itself a directional signal.
Overbought and Oversold levels
The two boundary levels are set by the Overbought Level and Oversold Level parameters. By default they sit at 80 and 20 — the most widely used values. On the MFI chart the levels are drawn as dashed horizontal lines together with the neutral 50 mid-line, so you literally see whether the MFI line has entered an extreme zone or is hovering around equilibrium. Tighten them for higher-conviction entries, or loosen them to act earlier.
Entry points
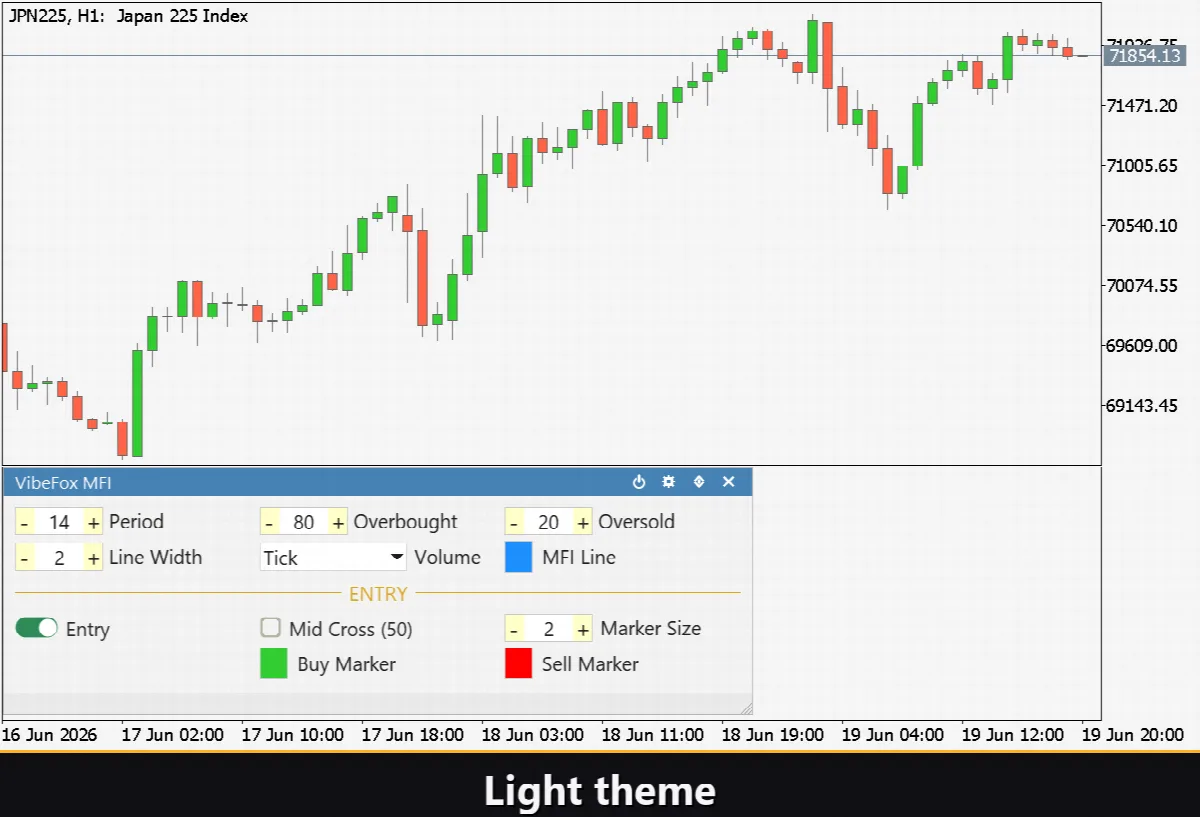
The main value of VibeFox MFI is its automatic entry points: the indicator tracks the conditions itself and places a clear arrow marker right on the price chart. Two independent signal types are available, each with its own toggle.
Entry — OB/OS Exit
The primary signal fires when the MFI line exits an extreme zone — that is, when it crosses back below the overbought level or back above the oversold level. A cross from overbought downward places a SELL marker; a cross from oversold upward places a BUY marker. This exit-based logic filters out premature signals that fire while the oscillator is still deep inside an extreme, keeping only the entries that coincide with a confirmed reversal of money flow.
Mid Cross (50 line)
The second signal catches the moment the MFI line crosses the 50 mid-line: upward through 50 places a BUY marker, downward through 50 places a SELL marker. This is a trend-following signal: it fires when the balance of money flow tips from bearish to bullish or vice versa, useful as an early directional filter or as confirmation for the OB/OS signals.
Buy and sell markers are colored separately with the Buy Marker and Sell Marker colors, so direction is read instantly, while the Marker Size control scales the arrows from 1 to 5 to fit any chart density.
Full visual control
Every element of the subwindow is tuned to your taste. The color of the MFI line is set individually and has its own transparency slider — you can make the line a pale background trace or highlight it with a rich color. The Line Width control sets the thickness of the MFI line in pixels, and the three dashed horizontal levels — Overbought, 50 mid, and Oversold — are always visible as reference marks inside the fixed 0..100 range.
Interactive on-chart panel
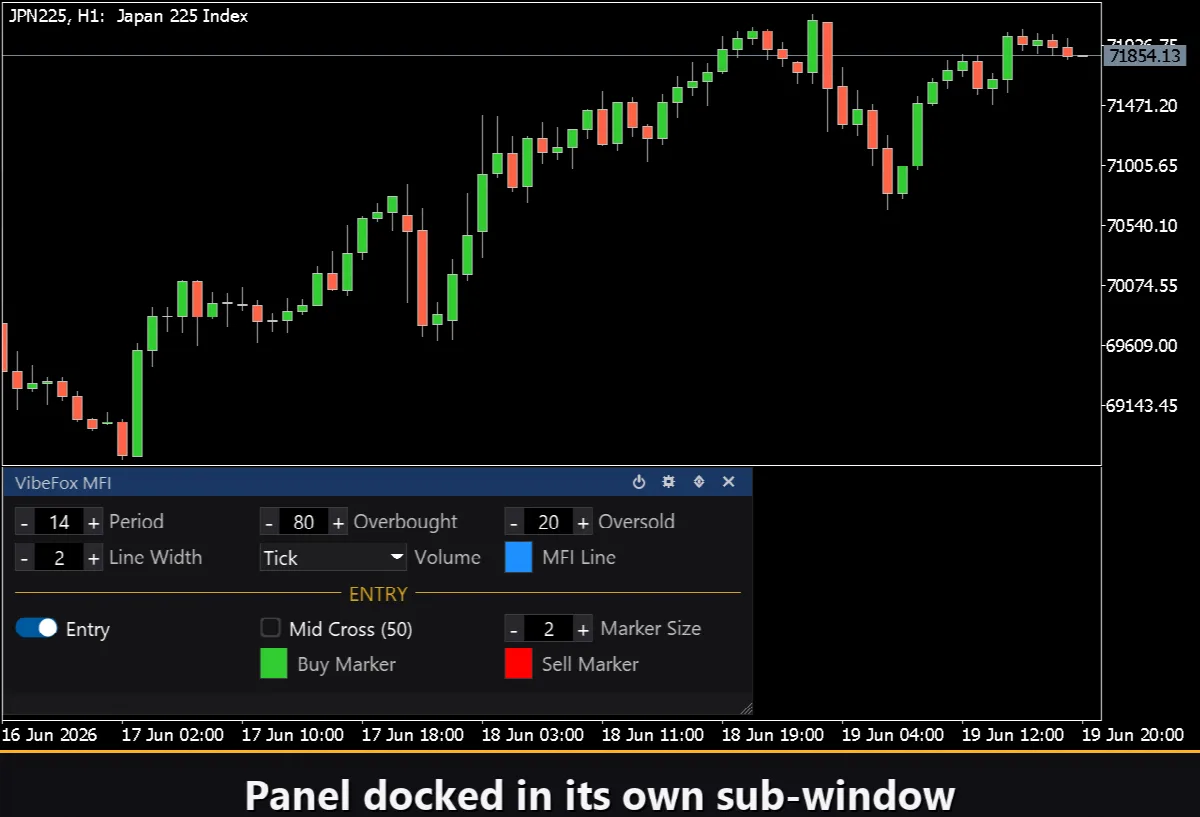
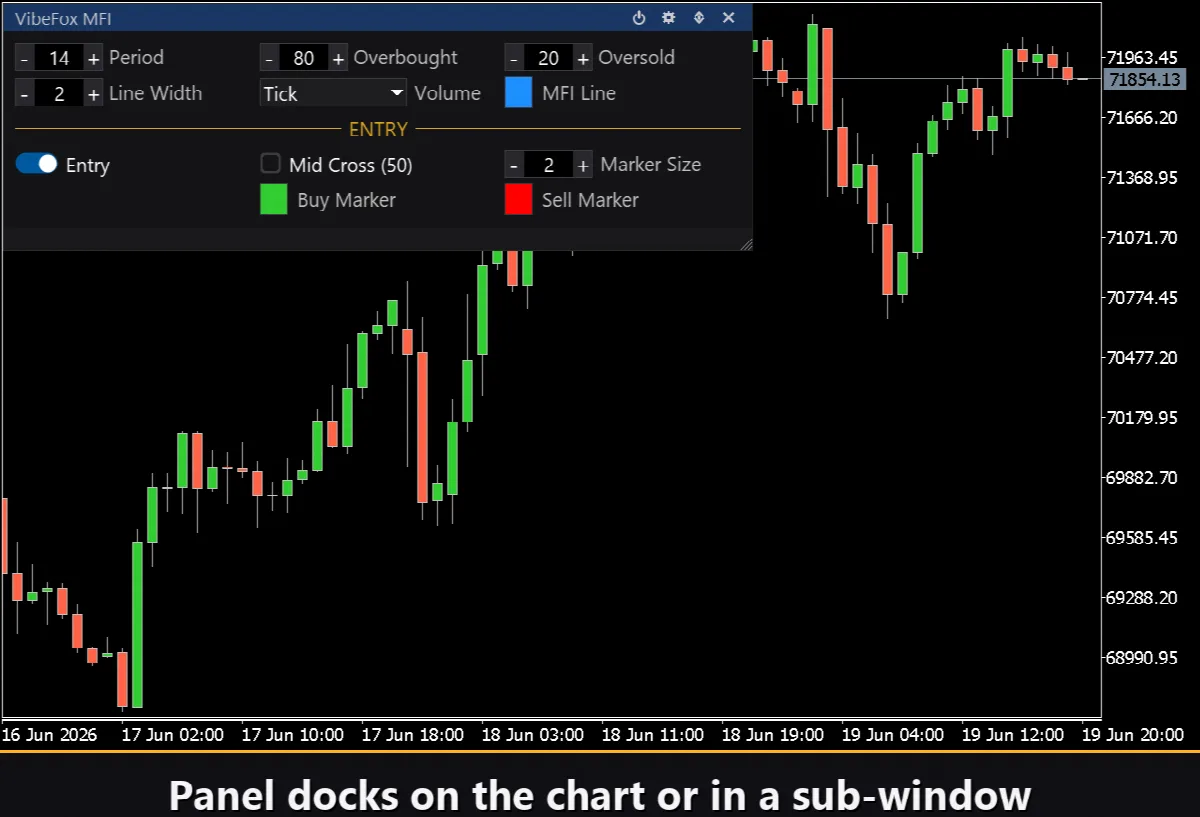
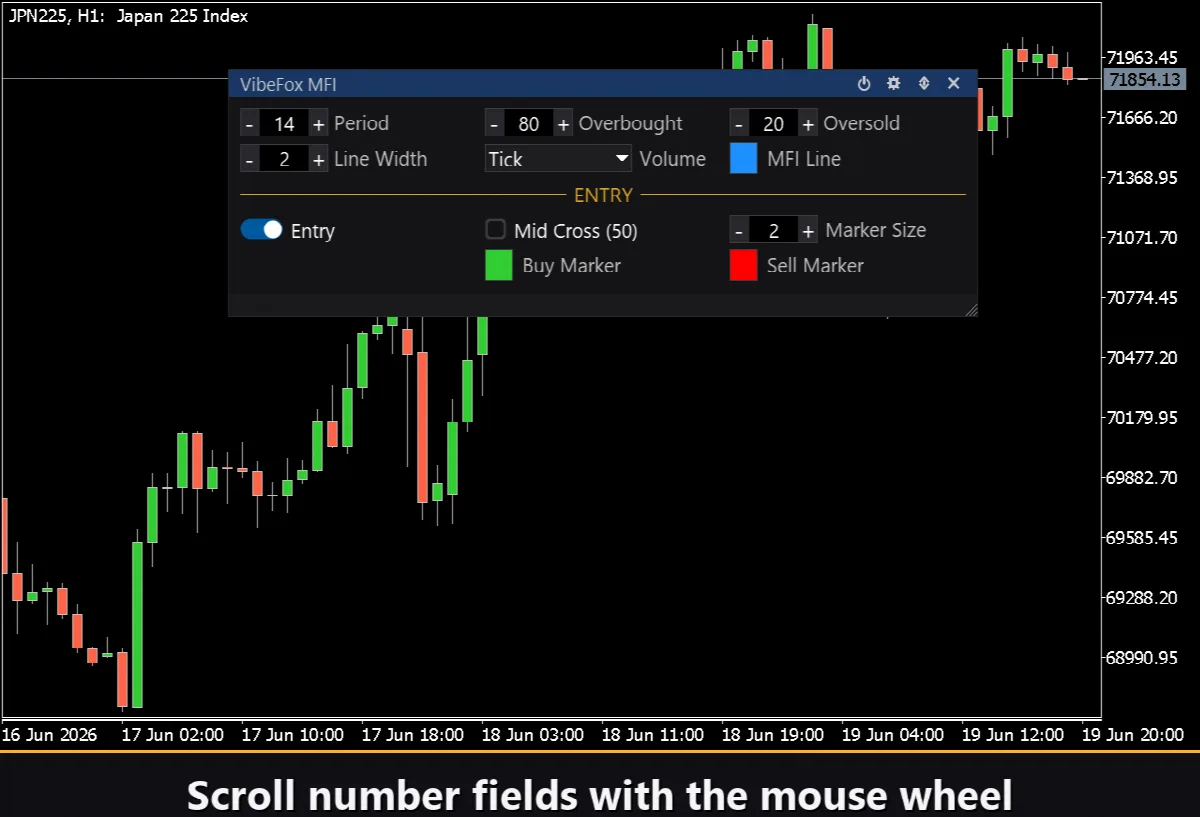
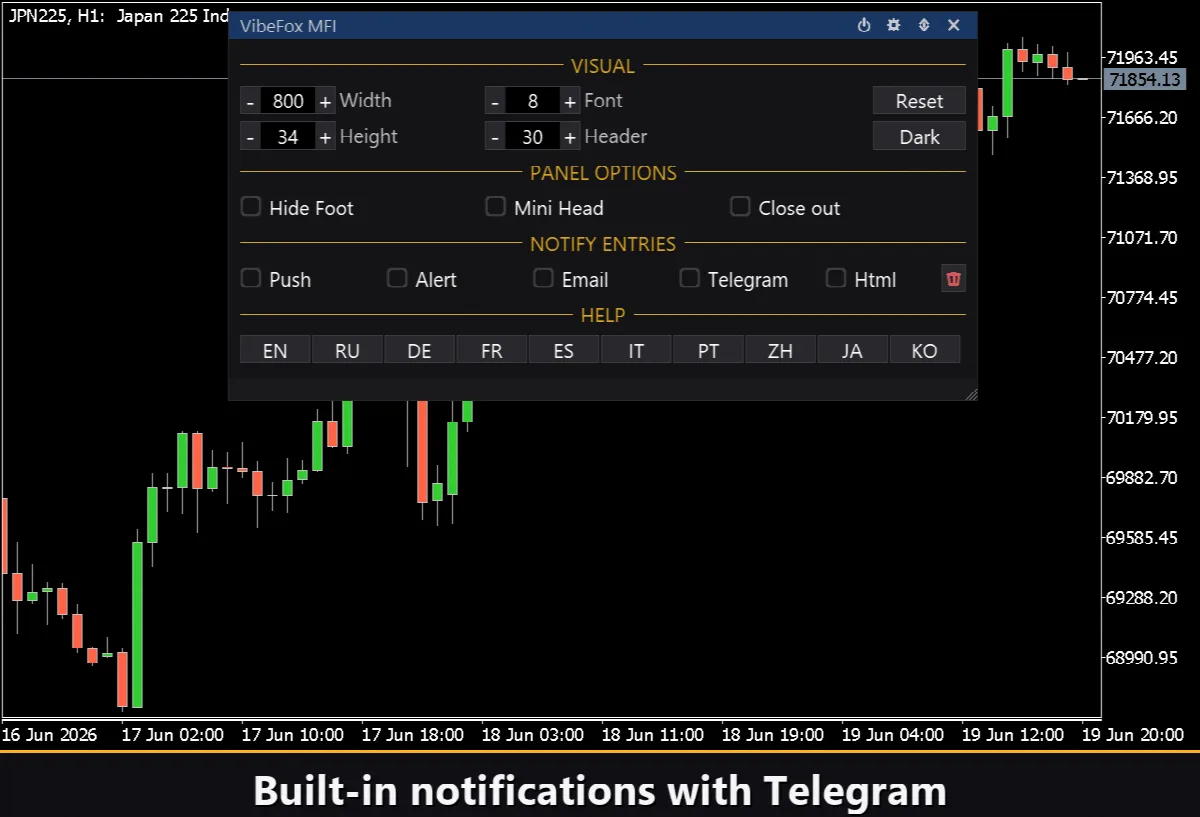
The whole interface is a smooth canvas-based panel built for fast mouse control. All parameters are gathered into tidy rows in three columns, and the entry block is set apart with its own gold ENTRY heading, so signal settings do not get mixed up with line settings. The panel header holds the control icons.
Power — turns the drawing of lines and signals on and off without removing the indicator from the chart.
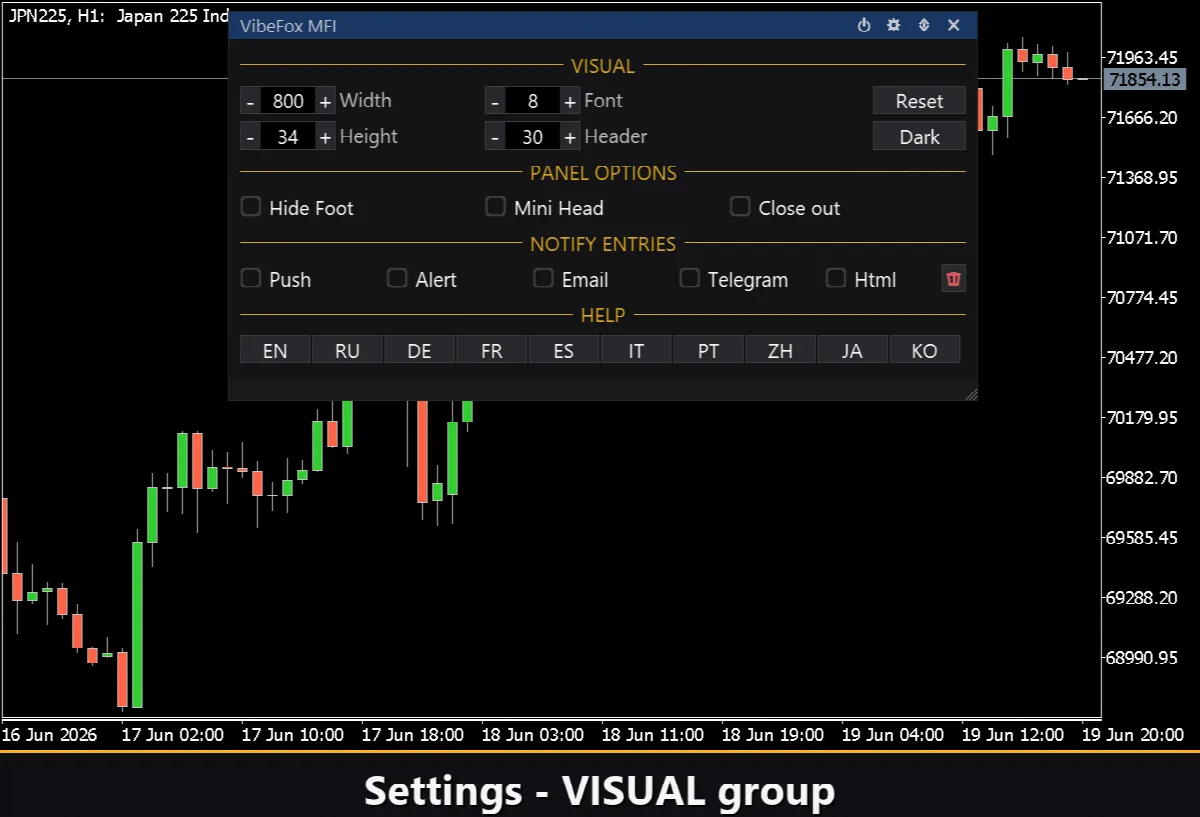
Settings (gear) — opens and closes the settings section.
Updown (arrows) — moves the panel between a separate subwindow and the main chart.
Close (cross) — closes the indicator.
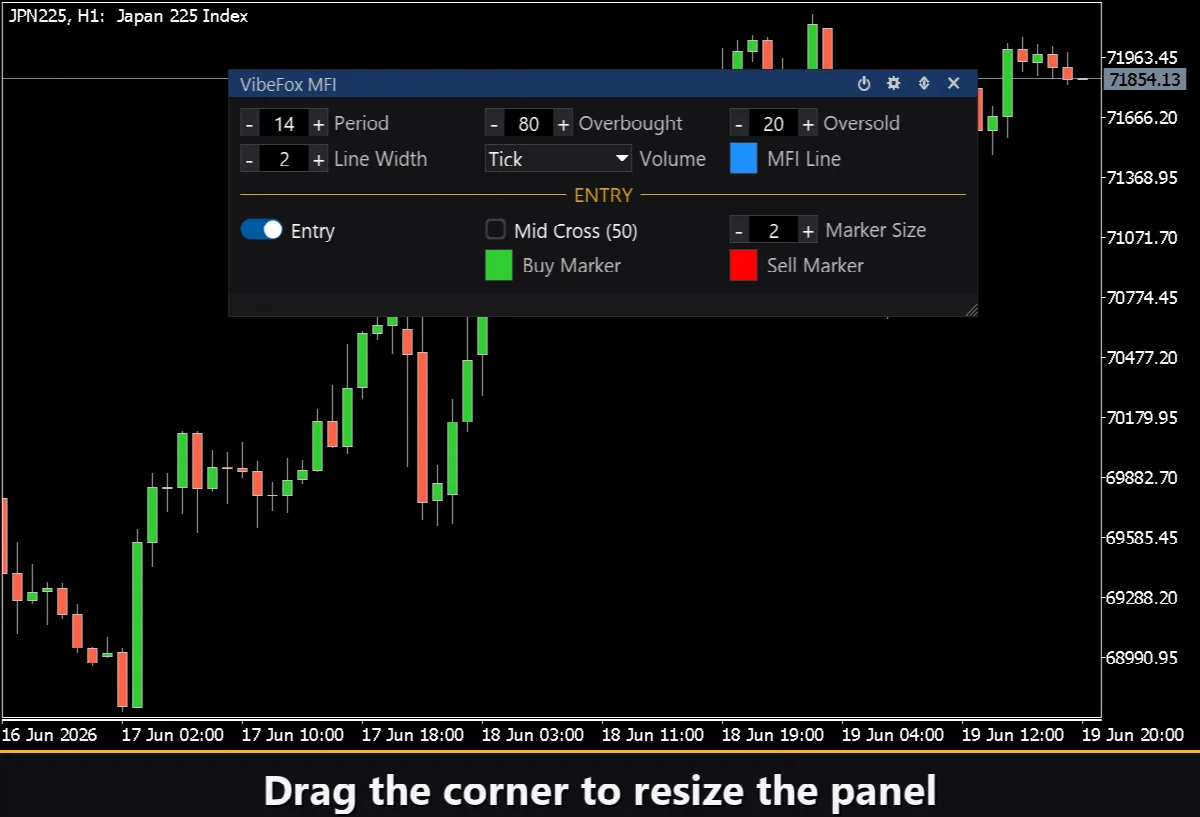
Resizable — drag the bottom-right corner to scale the panel.
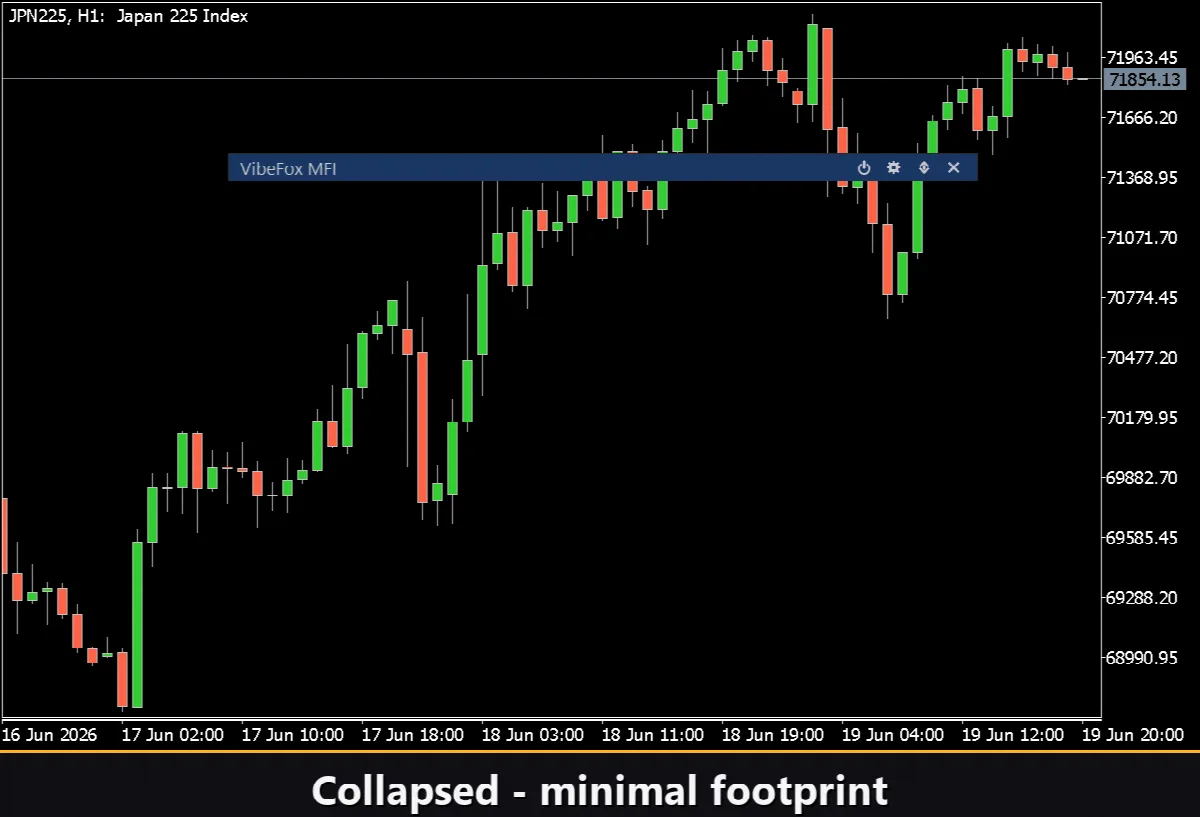
Collapsible — a double click on the header collapses the panel into a compact strip.
Mouse wheel — hover over any numeric field and scroll the wheel to change the value without opening the keyboard.
Settings and personalization
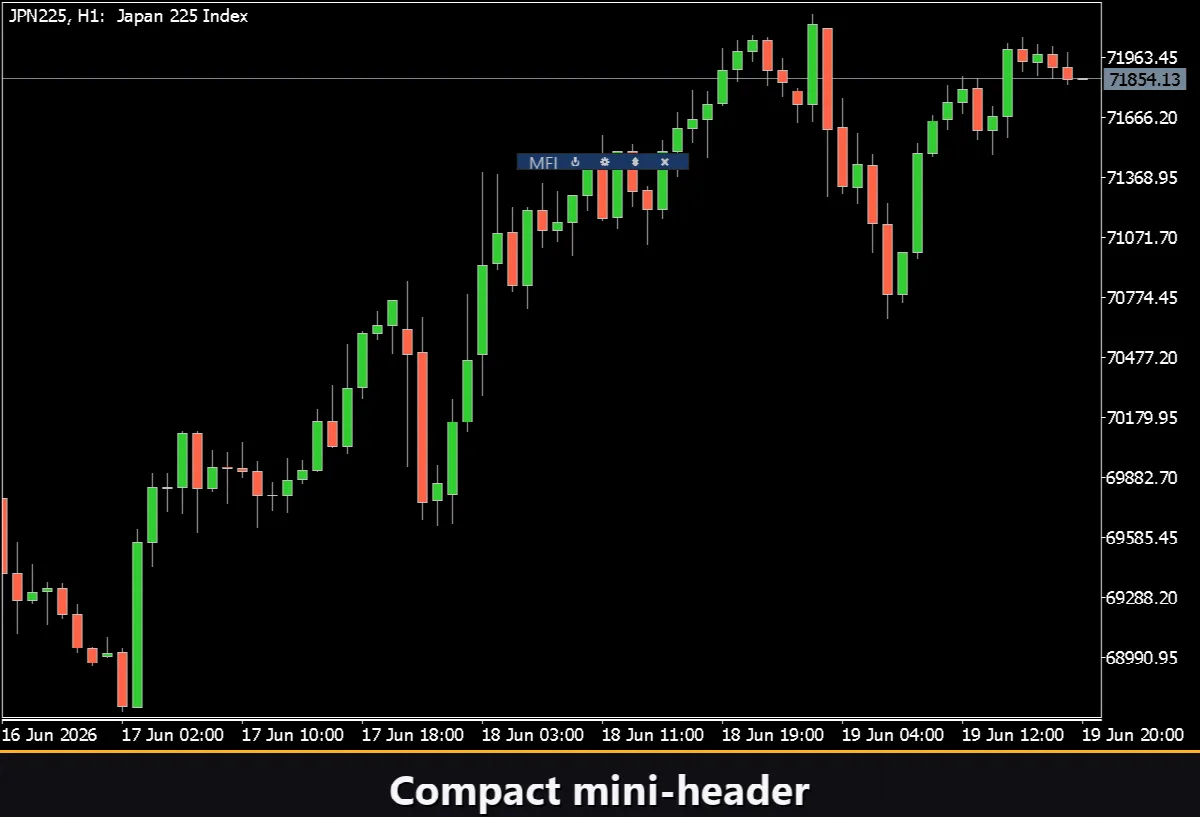
The Settings button opens a section where the panel is fitted to your workspace: a light, dark or automatic Theme, an adjustable panel width, header size, row height and font size. Extra touches let you hide the bottom bar via Hide Footer, shrink the header when collapsed with Mini Header, and automatically collapse the panel on a click outside it. Almost every parameter changes live right on the panel — the input fields on the Inputs tab only set the starting values at startup. You can also run several independent copies on one chart by giving each a unique Instance, to watch different MFI periods or volume types side by side.
Entry notifications
You do not need to sit and guard the chart waiting for a signal. Each entry can be sent through several notification channels that are enabled independently right on the panel.
Alert — a pop-up message inside the terminal.
Push — a mobile notification to the MetaTrader app on your phone.
Email — a letter sent through the terminal's mail settings.
Telegram — the alert text together with a chart screenshot, sent straight to your Telegram chat.
Enable only the channels you need, and you will be notified the moment a new entry appears on the symbol and timeframe you are working with.
Visual history (HTML report)
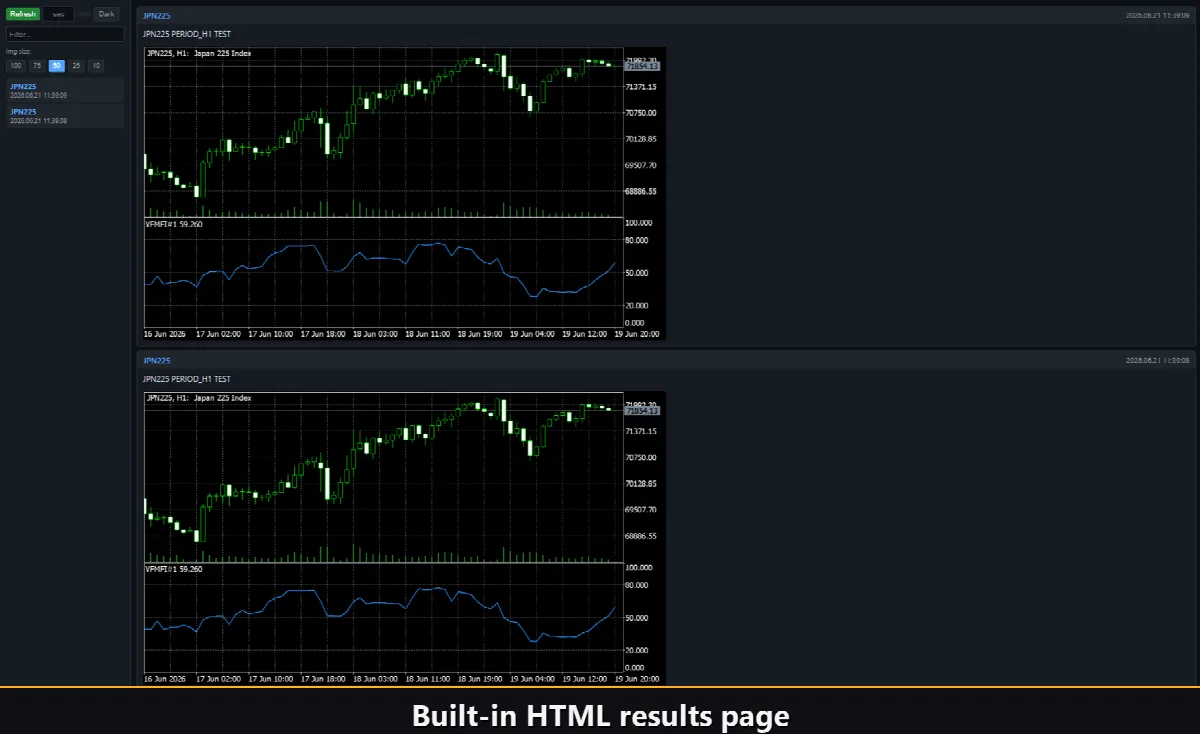
Enable the Html channel, and every entry signal is saved to an HTML report together with a screenshot of the chart at the moment it fired. The report is stored in the terminal's Files folder, in the VibeFox_MFI directory, and opens in any browser — you get a visual log of all the entries the indicator found. A one-click trash button clears the report and its screenshots whenever you want to start over.
Telegram Alerts
Signals can also be delivered straight to your Telegram chat — the alert text together with a screenshot of the chart at the moment of detection. Turn on the Telegram channel and enter your bot token and chat id in the inputs.
Delivery rides on the HTML report: each new signal is written into the report, and the report — opened in a browser — forwards it to your Telegram chat on its own. For this reason, enabling Telegram automatically keeps the Html report on, and the two channels work together.
Built-in multilingual help
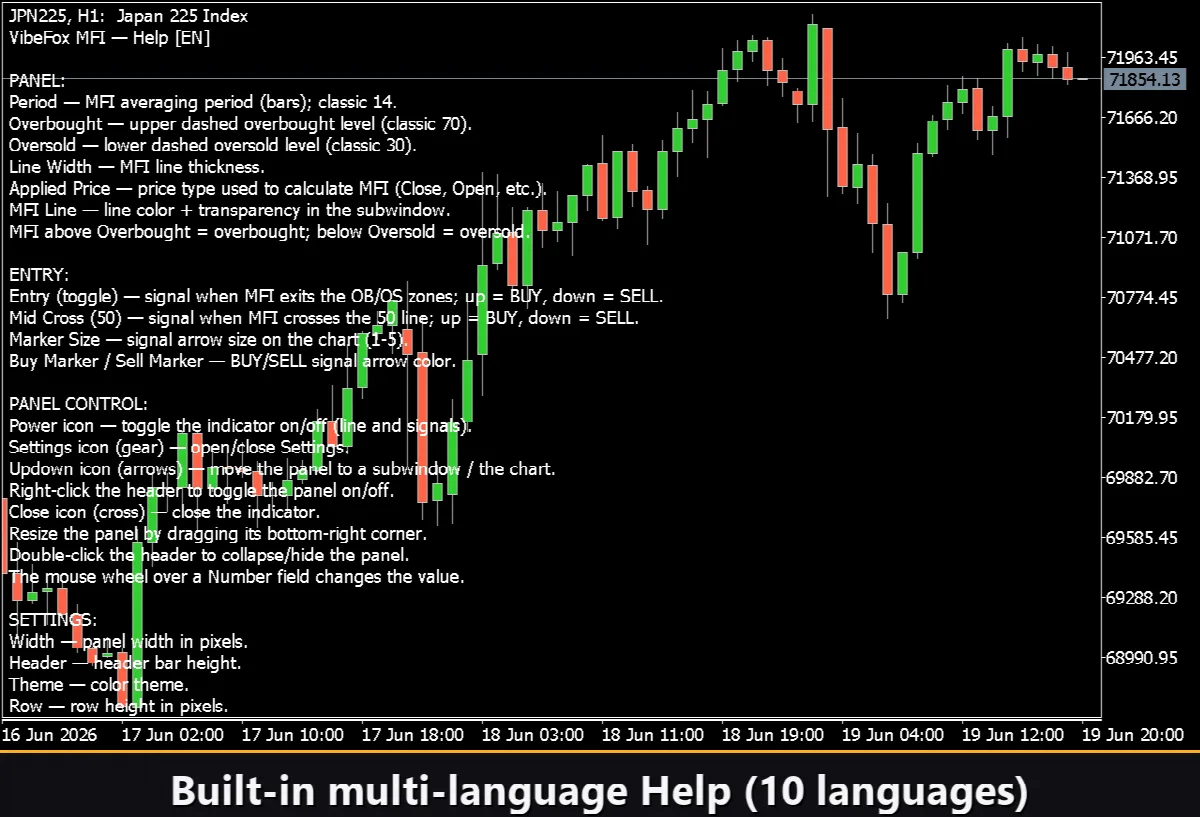
A full help page is built into the panel, available in 10 languages, so every control is explained right where you use it.