






VibeFox Keltner Revert MT5
30,00 €
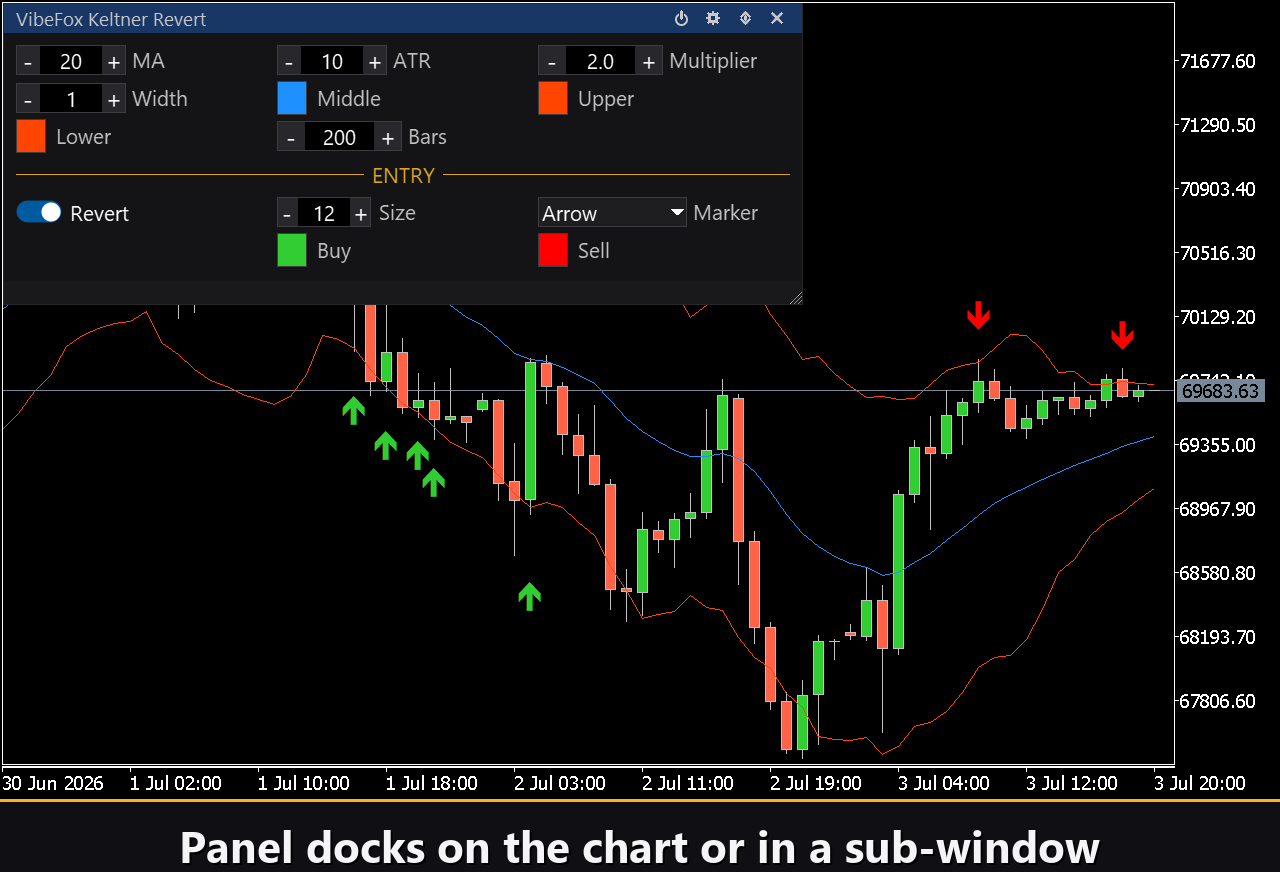
VibeFox Keltner Revert is a real-time channel indicator for MetaTrader 5. It builds a classic Keltner channel — an EMA middle line wrapped in two ATR-based volatility bands — draws all three bands right on the price chart, and marks a mean-reversion entry whenever price stretches to an outer band and snaps back toward the middle. Every control is gathered into one modern interactive panel, so instead of watching the bands by hand you see each revert setup the moment it forms.
VibeFox Keltner Revert — mean-reversion on a volatility channel with entry points
VibeFox Keltner Revert is a real-time channel indicator for MetaTrader 5. It builds a classic Keltner channel — an EMA middle line wrapped in two ATR-based volatility bands — draws all three bands right on the price chart, and marks a mean-reversion entry whenever price stretches to an outer band and snaps back toward the middle. Every control is gathered into one modern interactive panel, so instead of watching the bands by hand you see each revert setup the moment it forms.
How the indicator works
The channel is derived from two well-known building blocks. The middle line is an EMA of the typical price — (High + Low + Close) / 3 — over the MA Period, so it tracks the trend while smoothing intrabar noise. The band width is driven by the ATR (Average True Range) over the ATR Period, a pure volatility measure. The two outer bands are placed a fixed number of ATRs away from the middle, set by the Multiplier: the upper band is Middle + Multiplier × ATR, and the lower band is Middle − Multiplier × ATR.
Because the width is tied to ATR, the channel breathes with the market — it widens when volatility rises and contracts when the market calms down — while the EMA keeps the whole envelope gliding along the trend. The Bars setting limits how much history is processed: set it to 0 to use all available bars, or a smaller value for faster redraws on heavy charts.
The three bands are drawn directly on the price chart as line objects, while the indicator itself lives in its own subwindow, where the control panel sits.
The Keltner channel
A Keltner channel frames price between a trend-following middle line and two volatility envelopes. Most of the time price oscillates inside the channel; the outer bands act as dynamic, volatility-scaled extremes. A touch of the upper band marks an area where the move up is stretched relative to recent volatility, and a touch of the lower band marks a stretched move down. The middle EMA is the channel’s center of gravity — the level price tends to gravitate back toward after an outer-band excursion.
The Revert (mean-reversion) logic
VibeFox Keltner Revert trades the return to the mean rather than the breakout. The idea is simple: when price pushes to an outer band and then rejects it, closing back inside the channel, a snap-back toward the middle line often follows.
A BUY setup forms when a bar’s low tags or pierces the Lower band and the same bar closes back above the Lower band — the market rejected the downside stretch, and the expected move is up toward the middle. A SELL setup is the mirror image: a bar’s high tags or pierces the Upper band and the bar closes back below the Upper band — the upside stretch was rejected, and the expected move is down toward the middle. Signals are evaluated only on closed bars; the currently forming bar is ignored, so a marker never repaints once printed.
Entry points
The main value of VibeFox Keltner Revert is its automatic entries. When a valid revert setup completes on a closed bar, the indicator places a clear marker right on the price chart at the signal price. The single Revert toggle turns the mean-reversion entries on or off; buy and sell markers are colored separately with the Buy and Sell color settings, so direction is read at a glance.
The Marker selector switches the glyph between a plain cross (+), filled triangles, or arrows with a tail, while the Size control scales the marker in pixels (6 to 40) to fit any chart density.
Full visual control
Each of the three bands has its own color — Middle, Upper and Lower — and the line thickness is set with Width from 1 to 5 pixels. Every band and both entry markers support a transparency setting (0-100%) in the color picker popup, so you can blend the channel softly into the chart or make the signals pop against any background.
Interactive on-chart panel
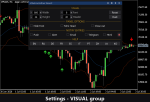
The whole interface is a smooth canvas-based panel built for fast mouse control. The channel parameters are gathered into tidy rows, and the entry block is set apart with its own gold ENTRY heading, so signal settings do not get mixed up with band settings. The panel header holds the control icons.
Power — turns the drawing of entry markers on and off without removing the indicator from the chart.
Settings (gear) — opens and closes the settings section.
Updown (arrows) — moves the panel between its subwindow and the main chart.
Close (cross) — closes the indicator.
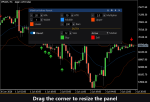
Resizable — drag the bottom-right corner to scale the panel.
Collapsible — a double click on the header collapses the panel into a compact strip.
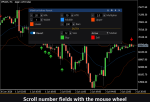
Mouse wheel — hover over any numeric field and scroll the wheel to change the value without opening the keyboard.
Settings and personalization
The Settings button opens a section where the panel is fitted to your workspace: a light, dark or automatic Theme, an adjustable panel width, header size, row height and font size. Extra touches let you hide the bottom bar via Hide Footer, shrink the header when collapsed with Mini Header, and automatically collapse the panel on a click outside it. Almost every parameter changes live right on the panel — the input fields on the Inputs tab only set the starting values. You can also run several independent copies on one chart by giving each a unique Instance, to compare different settings side by side.
Entry notifications
You do not need to sit and guard the chart waiting for a revert setup. Each entry can be sent through several notification channels that are enabled independently right on the panel.
Alert — a pop-up message inside the terminal.
Push — a mobile notification to the MetaTrader app on your phone.
Email — a letter sent through the terminal’s mail settings.
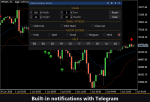
Telegram — the alert text together with a chart screenshot, sent straight to your Telegram chat.
Enable only the channels you need, and you will be notified the moment a new Keltner revert entry appears on the symbol and timeframe you are working with.
Visual history (HTML report)
Enable the Html channel, and every entry signal is saved to an HTML report together with a screenshot of the chart at the moment it fired. The report is stored in the terminal’s Files folder, in the VibeFox_Keltner_Revert directory (MQL5/Files/VibeFox_Keltner_Revert/result.html), and opens in any browser — you get a visual log of all the reverts the indicator found. A one-click trash button clears the report and its screenshots whenever you want to start over.
Telegram Alerts
Signals can also be delivered straight to your Telegram chat — the alert text together with a screenshot of the chart at the moment of detection. Turn on the Telegram channel and enter your bot token and chat id in the inputs.
Delivery rides on the HTML report: each new signal is written into the report, and the report — opened in a browser — forwards it to your Telegram chat on its own. For this reason, enabling Telegram automatically keeps the Html report on, and the two channels work together.
Built-in multilingual help
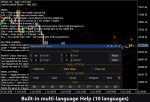
A full help page is built into the panel, available in multiple languages, so every control is explained right where you use it.
Loading...