












VibeFox Fractals MT5
30,00 €
VibeFox Fractals is a real-time Bill Williams fractals indicator for MetaTrader 5. It marks every local peak and trough on the price chart, turns the latest confirmed fractal into a ready-made level for a breakout signal, and gathers all controls into one modern interactive panel. Instead of hunting for reversals by hand and keeping the last meaningful high and low in your head, you instantly see the market structure and the moment price breaks through its boundary.
VibeFox Fractals — Bill Williams fractals and fractal-break entries
VibeFox Fractals is a real-time Bill Williams fractals indicator for MetaTrader 5. It marks every local peak and trough on the price chart, turns the latest confirmed fractal into a ready-made level for a breakout signal, and gathers all controls into one modern interactive panel. Instead of hunting for reversals by hand and keeping the last meaningful high and low in your head, you instantly see the market structure and the moment price breaks through its boundary.
What the fractals show
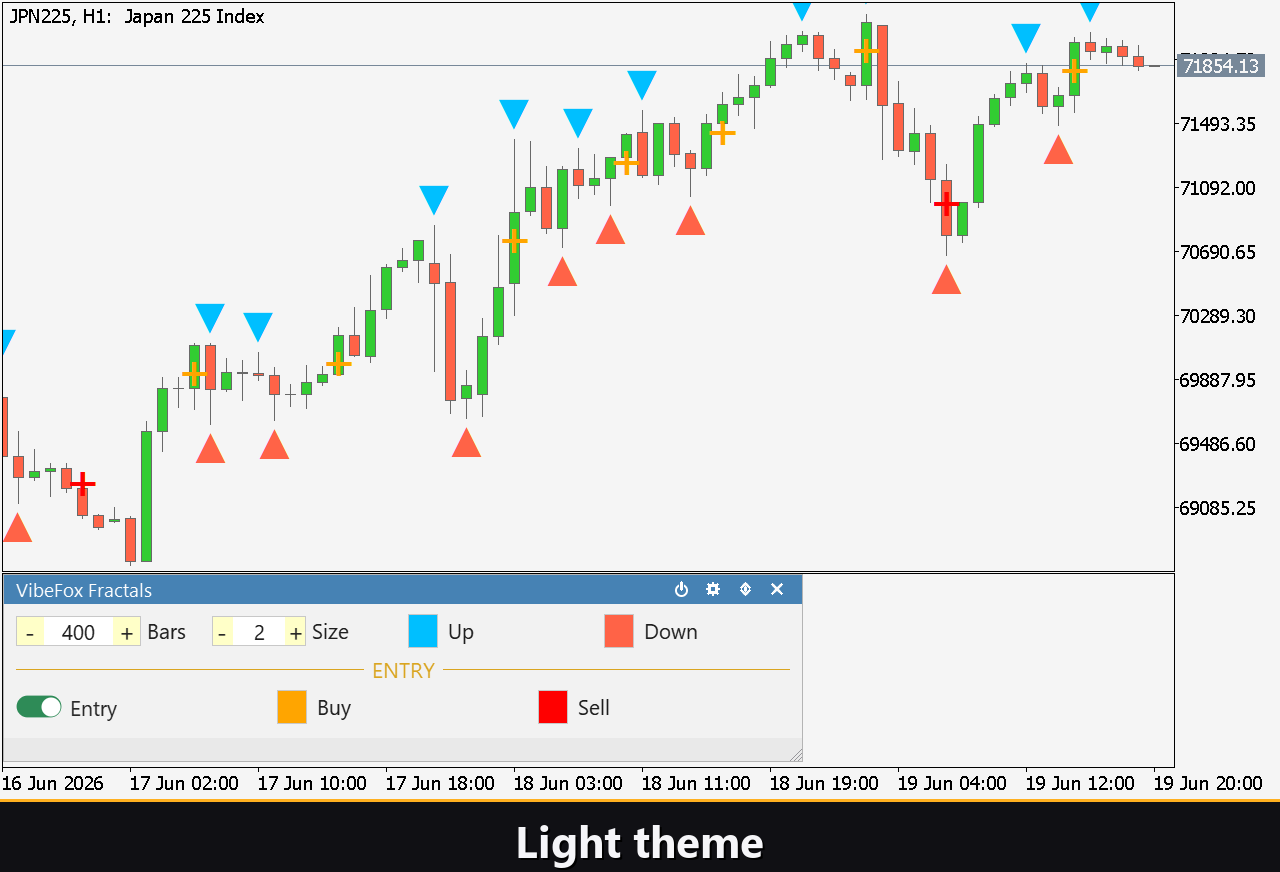
A fractal is the classic Bill Williams reversal pattern. An Up Fractal forms on a bar whose high is above the highs of the neighboring bars on its left and right — a local peak. A Down Fractal forms on a bar whose low is below the lows of its neighbors — a local trough. The indicator uses the standard MetaTrader calculation, where a fractal needs two bars on each side to confirm: it counts as complete only after the two bars to its right have closed.
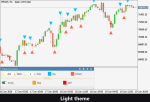
On the chart this reads at a glance: Up Fractal markers sit above the bar, Down Fractal markers sit below it. So you see the full chain of peaks and troughs that builds the market structure, and you instantly spot where the latest key levels are.
Entry points — fractal break
The main value of VibeFox Fractals is the automatic breakout entries. The indicator constantly tracks the latest confirmed fractal and places a clear arrow marker right on the price chart the moment the closing price breaks that level.
The logic is simple and unambiguous: if the closing price breaks above the last Up Fractal, a BUY marker is placed; if the closing price breaks below the last Down Fractal, a SELL marker is placed. Once it fires, the level is treated as consumed — the indicator waits for a fresh fractal to form before looking for another break in the same direction. Signals are detected only on closed bars: the last, still-forming bar is excluded, so the arrows never repaint after the fact.
The whole entry block is driven by a single Entry toggle — that toggle is the entry condition itself. Buy and sell markers are colored separately with Buy and Sell, so the direction reads instantly.
Full visual control
The look adapts to your taste. Up and down fractal colors are set separately — Up Fractal and Down Fractal — and each has its own transparency slider, to make the markers bolder or, conversely, softer and more subtle. Entry signal arrows are colored with Buy and Sell, also with transparency control.
A shared Marker Size control scales all markers on the chart from 1 to 5 — it affects both the fractals and the signal arrows at once, so it is a single visual density setting rather than part of the entry block. The Bars parameter sets how many history bars to analyze: the more, the deeper into the past the fractals and signals are mapped.
Interactive on-chart panel
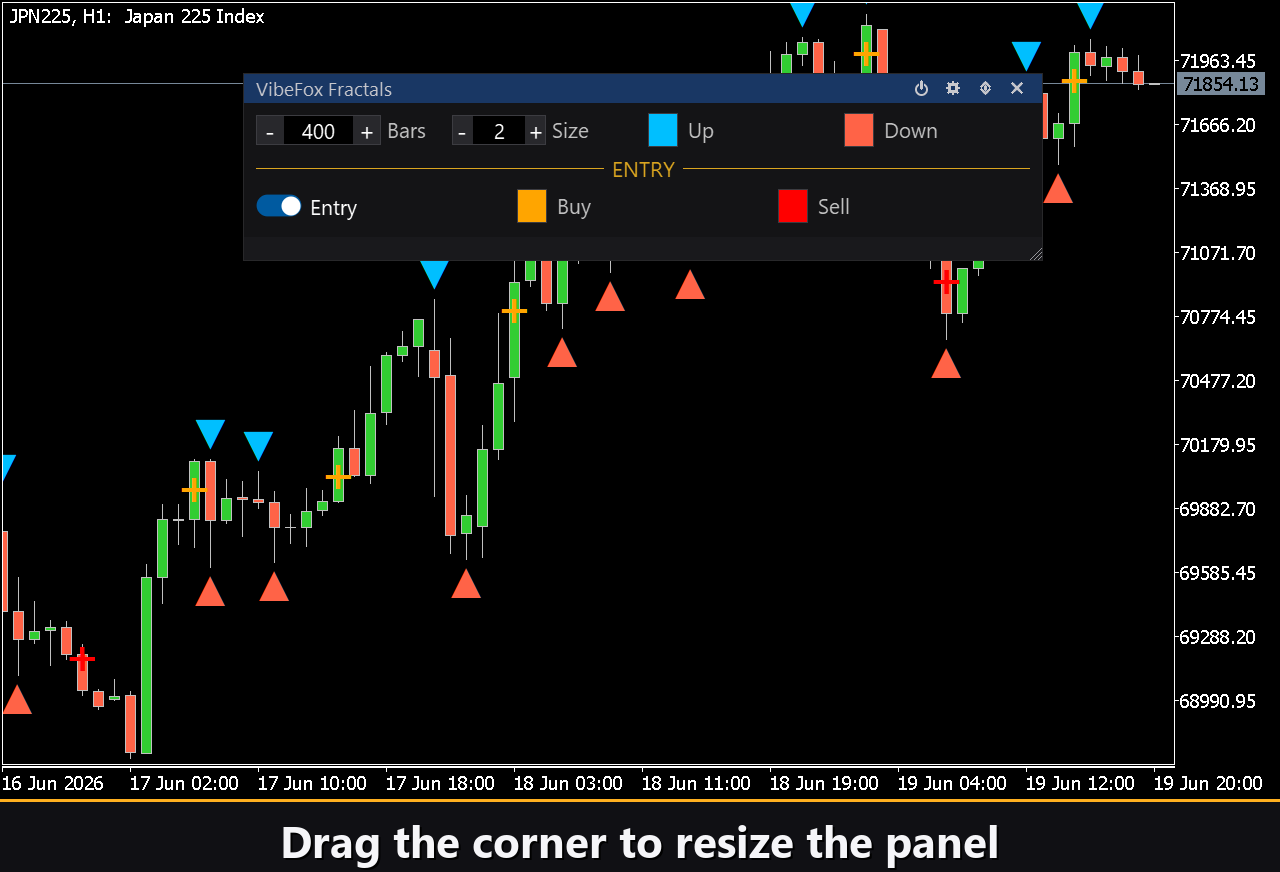
The whole interface is a smooth canvas-based panel built for fast mouse control. All parameters are arranged into tidy three-column rows, and the entry block is set off by a separate gold ENTRY heading, so signal settings don’t get mixed up with fractal settings. The panel header holds the control icons.
Power — toggles drawing of fractals and signals on and off without removing the indicator from the chart.
Settings (gear) — opens and closes the settings section.
Updown (arrows) — moves the panel between a separate subwindow and the main chart.
Close (cross) — closes the indicator.
Resizable — drag the bottom-right corner to scale the panel.
Collapsible — double-click the Header to collapse the panel into a compact strip.
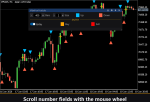
Mouse wheel — hover over any Number field and scroll the wheel to change the value without opening the keyboard.
Settings and personalization
The Settings button opens a section where the panel fits your workspace: a light, dark, or automatic Theme, an adjustable panel width, Header size, Row height, and Font size. Extra touches let you hide the bottom bar via Hide Footer, shrink the header when collapsed with Mini Header, and auto-collapse the panel on a click outside it. Almost every parameter can be changed live right on the panel — the input fields on the Inputs tab only set the starting values. You can also run several independent copies on one chart by giving each a unique Instance.
Entry notifications
You don’t have to sit and watch the chart waiting for a break. Each entry can be sent over several notification channels, enabled independently right on the panel, in the NOTIFY ENTRIES group.
Alert — a popup message inside the terminal.
Push — a mobile notification to the MetaTrader app on your phone.
Email — a message sent through the terminal’s mail settings.
Telegram — the alert text together with a chart screenshot, sent straight to your Telegram chat.
Enable only the channels you need, and you’ll be notified the moment a new entry appears on the symbol and timeframe you’re working with. Notifications are sent only for signals that are actually visible on the chart.
Visual history (HTML report)
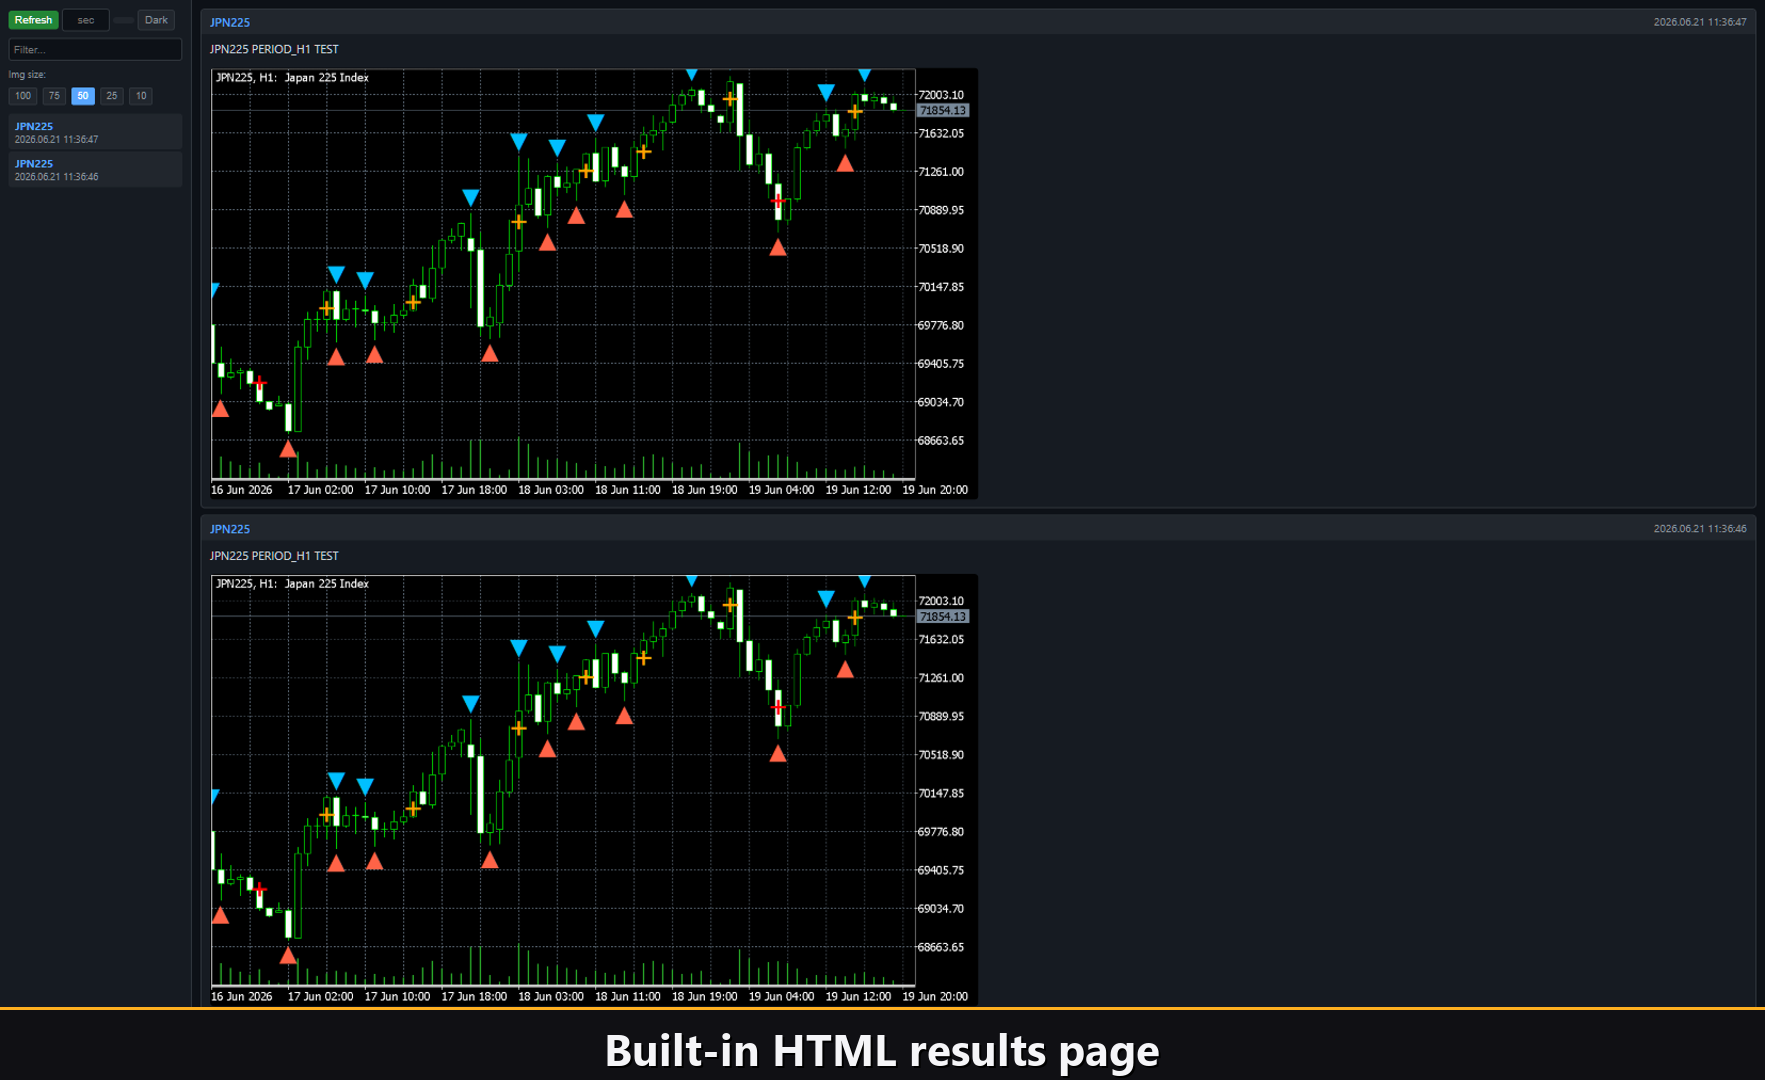
Enable the Html channel and each entry signal is saved to an HTML report together with a chart screenshot at the moment it fired. The report lives in the terminal’s Files folder, in the VibeFox_Fractals directory (the result.html file), and opens in any browser — a visual log of every break the indicator found. The trash icon clears the report and its screenshots in one click whenever you want to start fresh.
Telegram Alerts
Signals can also be delivered straight to your Telegram chat — the alert text together with a screenshot of the chart at the moment of detection. Turn on the Telegram channel and enter your bot token and chat id in the inputs.
Delivery rides on the HTML report: each new signal is written into the report, and the report — opened in a browser — forwards it to your Telegram chat on its own. For this reason, enabling Telegram automatically keeps the Html report on, and the two channels work together.
Built-in multilingual help
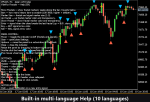
A full help page is built into the panel, available in 10 languages, so every control is explained right where you use it.
Loading...
Loading...