







VibeFox Volume Profile MT5
30,00 €
VibeFox Volume Profile is a complete Volume Profile toolkit for MetaTrader 5. It builds the horizontal distribution of traded volume across price, so you can instantly see where the market spent the most activity, where it traded thin, and which price levels are likely to act as magnets or barriers. Every profile is drawn directly on the chart and controlled from a modern, mouse-driven panel — no menus to dig through, no scripts to attach.
VibeFox Volume Profile — Volume Profile for MetaTrader 5
VibeFox Volume Profile is a complete Volume Profile toolkit for MetaTrader 5. It builds the horizontal distribution of traded volume across price, so you can instantly see where the market spent the most activity, where it traded thin, and which price levels are likely to act as magnets or barriers. Every profile is drawn directly on the chart and controlled from a modern, mouse-driven panel — no menus to dig through, no scripts to attach.
Instead of guessing support and resistance from candles alone, you work with the real footprint of volume: the high-volume nodes that attract price, the low-volume gaps it tends to pass through quickly, and the fair-value zone where most business was done.
Volume Profile, the Way You Need It
Volume Profile is not a single fixed profile. It gives you several independent profile engines at once, each with its own range, placement and styling, so you can study the market from more than one angle on the same chart.
From-To — a precise profile built between two draggable lines, From and To. Drop the lines around any swing, range or news spike and read the distribution of exactly that segment. A Right side option flips which way the histogram is drawn.
Magnet Right and Magnet Left — magnetic profiles anchored to a single draggable line that stretch to the edge of the screen. They follow the visible price action and continuously highlight the dominant levels to the right or left of your chosen anchor.
Session — automatic Asia, Europe and USA session profiles built over the last N days. Each session has its own start and end time, its own region highlight, and its own Bar, POC and Value Area styling, so you can compare how different trading hours shaped price.
Box 1 to Box 5 — up to five free-floating rectangular zones. Drag a box by its numbered handle, resize it from the corners, and Volume Profile rebuilds the volume distribution inside it. Use them to keep several areas of interest under analysis side by side.
POC, Value Area and Volume Nodes
For every profile, Volume Profile computes the key Volume Profile reference levels automatically.
POC (Point of Control) marks the single price with the highest traded volume — the strongest magnet in the range.
Value Area covers the band that holds the classic 70% of total volume, expanding outward from the POC. This is the fair-value zone where the market agreed on price, with its upper and lower edges acting as natural boundaries.
The histogram bars show the full volume distribution at a glance, so high-volume nodes and low-volume gaps stand out immediately.
Built for Any Symbol and Timeframe
You choose the timeframe of the volume data used to build every profile, independent of the chart timeframe. A finer data timeframe produces a more detailed distribution, while a coarser one keeps it light — you decide the balance.
Each profile has an adjustable number of Bands (from 50 to 500), letting you set how granular the histogram is, plus its own width and update interval so live profiles refresh exactly as often as you need.
Full Visual Control
Every profile is fully stylable and kept visually separate from the others.
Bar, POC and Value Area colors are set per profile, each with its own transparency slider, so overlapping profiles stay readable and you can colour-code them to your own system.
Session profiles add a region highlight behind each trading window, making the Asia, Europe and USA blocks easy to tell apart at a glance.
A per-profile Reset restores its appearance, and a Find action brings a profile back into view if you have scrolled away from it.
Interactive On-Chart Panel
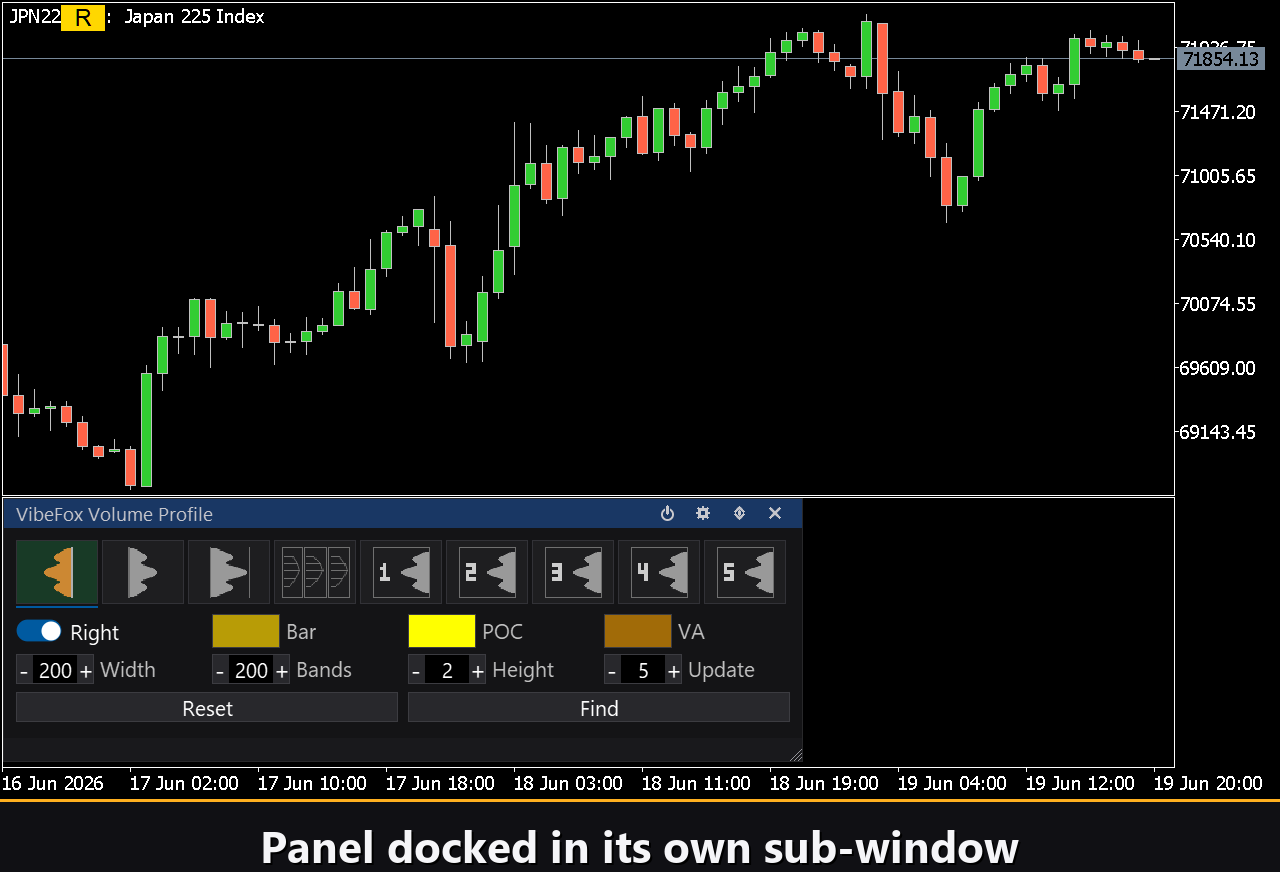
The whole interface is a smooth, canvas-based panel built for fast, mouse-driven control.
Profile tabs — left-click a tab (F-T, R, L, S, B1 to B5) to open its settings, right-click to switch the profile on or off instantly; a green tab means it is active.
Power — one click stops or runs all profiles at once.
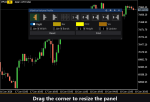
Resizable — drag the bottom-right corner to scale the panel.
Movable — switch the panel between a separate subwindow and the main chart with the up and down arrows.
Collapsible — double-click the header to fold the panel into a compact bar, with an optional mini header.
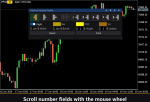
Mouse wheel — hover any Number field and scroll to change its value, with no typing.
Personalization
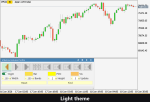
You adapt the look and behavior to your workspace: light, dark or automatic theme, adjustable panel width, header size, row height and font size. An optional Hide Footer mode keeps the panel minimal, and a Close on click outside option tidies the chart automatically. You can run several independent copies on the same chart by giving each one a unique instance number, so different setups never collide.
Built-in Multilingual Help
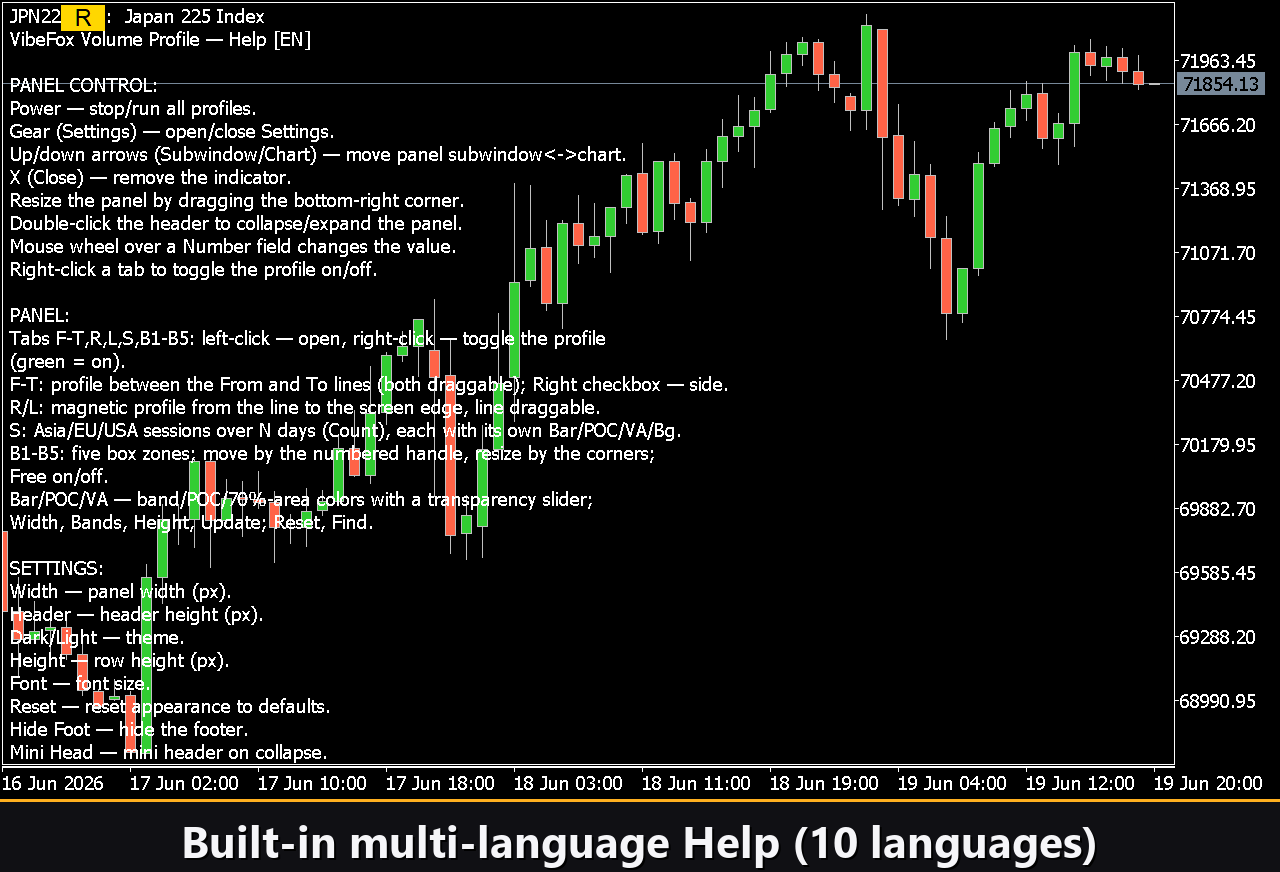
A complete help page is built into the panel and available in 10 languages, so every control is explained right where you use it.
Loading...
Loading...