
VibeFox Stochastic MT5
30,00 €
VibeFox Stochastic is a real-time Stochastic oscillator for MetaTrader 5. It draws two classic lines — %K and %D — in a separate subwindow on a 0–100 scale, marks Overbought and Oversold zones with dashed horizontal levels, and automatically places entry markers directly on the price chart the moment a signal forms. Instead of watching two lines and manually deciding whether a crossover or a zone exit is tradeable, you see a clear arrow at the exact bar where the condition was met.
VibeFox Stochastic — momentum oscillator with automatic entry signals
VibeFox Stochastic is a real-time Stochastic oscillator for MetaTrader 5. It draws two classic lines — %K and %D — in a separate subwindow on a 0–100 scale, marks Overbought and Oversold zones with dashed horizontal levels, and automatically places entry markers directly on the price chart the moment a signal forms. Instead of watching two lines and manually deciding whether a crossover or a zone exit is tradeable, you see a clear arrow at the exact bar where the condition was met.
What Stochastic measures
The Stochastic oscillator compares the current closing price to the range of prices over a look-back period. The core idea is simple: in a rising market, prices tend to close near the top of their recent range; in a falling market, they close near the bottom. The result is normalized to a 0–100 scale, so it is immediately obvious how stretched the market is relative to recent history.
The indicator draws two lines. %K is the main, faster line — it reacts directly to price changes and can be quite choppy on short periods. %D is a smoothed moving average of %K, acting as a signal line. Traders read the relationship between %K and %D: when %K is above %D the short-term momentum is pointing up; when %K drops below %D the momentum is shifting down. The direction of that relationship, and where it happens on the 0–100 scale, is the foundation of every Stochastic trading decision.
Two horizontal dashed lines — Overbought (default 80) and Oversold (default 20) — divide the oscillator window into three zones. Readings above 80 suggest the market has been persistently strong and may be stretched; readings below 20 suggest persistent weakness. These levels are not simple reversal triggers on their own, but they give essential context to the crossover and zone-exit signals.
The three periods
Stochastic has three period inputs that work in sequence, each smoothing the result a little further.
%K Period is the look-back window for the raw Stochastic calculation — the number of bars whose high-low range is used to place the current close on the 0–100 scale. A shorter %K Period makes the line more sensitive and faster; a longer period makes it smoother and slower to react. The default of 5 produces a nimble oscillator suitable for shorter timeframes.
Slowing applies an additional internal smoothing to %K before it is plotted. A Slowing of 1 gives you the raw “fast” Stochastic; a Slowing of 3 (the default) gives you the standard “slow” Stochastic that filters out some of the noise without dramatically delaying the signal. Increasing Slowing further softens the line at the cost of responsiveness.
%D Period is the number of bars used to smooth %K into the %D signal line. The default of 3 gives a responsive but still readable signal line. A longer %D Period makes the signal line lag more but cross %K less frequently, which can reduce false signals on choppy markets.
Entry points
VibeFox Stochastic automatically monitors the conditions you choose and places a colored arrow marker on the price chart at the exact bar where a signal fires. Two independent signal types are available, each with its own toggle in the panel. You can enable either one alone or both together, giving you a flexible approach to how you use the oscillator.
Entry — Signal Cross (%K / %D)
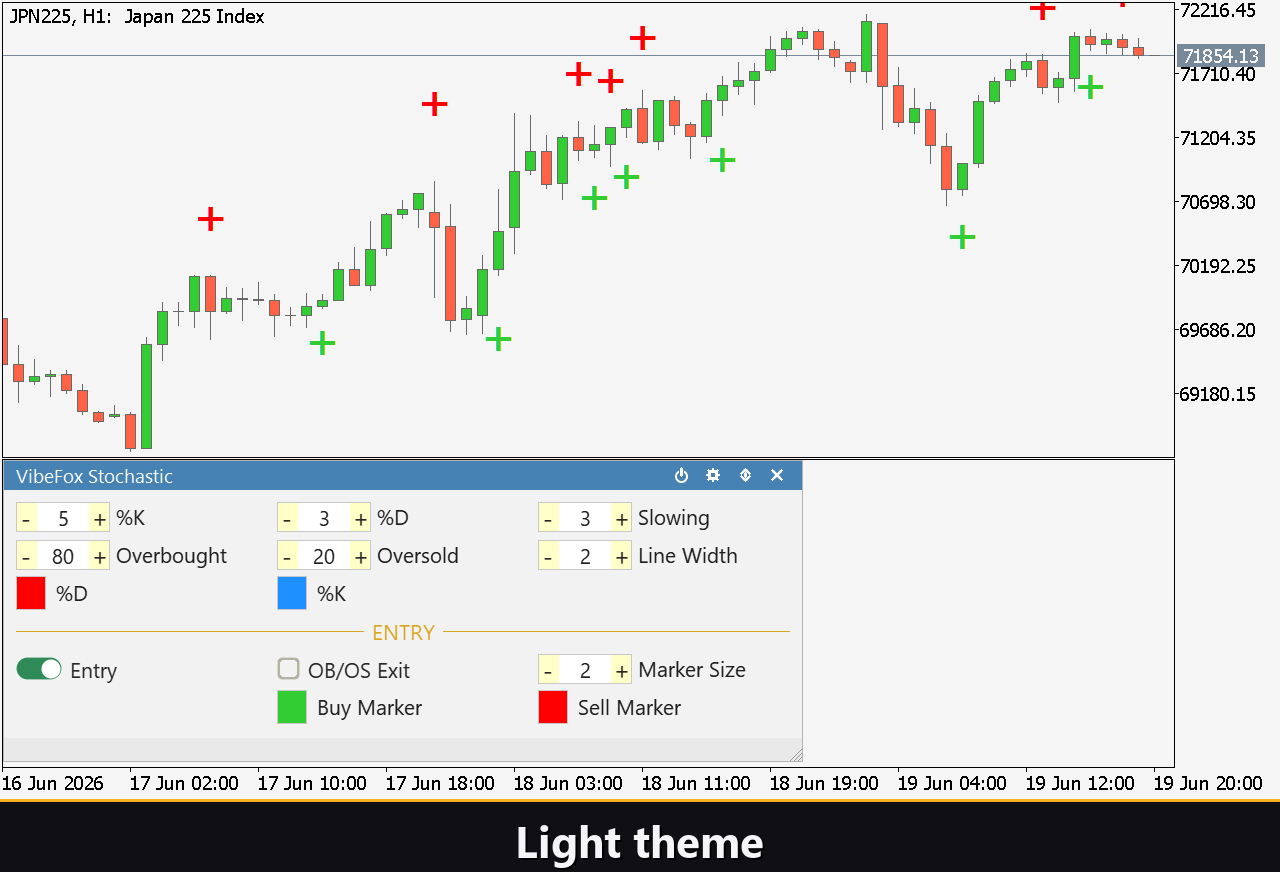
The primary signal fires every time %K and %D cross each other. When %K crosses %D from below upward, the momentum is shifting to the positive side and a BUY marker is placed on the chart. When %K crosses %D from above downward, the momentum is shifting negative and a SELL marker is placed. This signal is enabled by default. It works across the entire oscillator range, so crossovers inside the Overbought or Oversold zones are included — you can use the zone-exit signal alongside it to filter for those specific conditions.
OB/OS Exit — zone breakout
The second signal focuses specifically on the moment when %K exits an extreme zone — often the highest-conviction Stochastic trade setup. When %K crosses back below the Overbought level after having been above it, a SELL marker is placed: the market was overbought and the pressure is now unwinding. When %K crosses back above the Oversold level after having been below it, a BUY marker is placed: the market was oversold and is turning back up. This signal is disabled by default. You can run it alone or combine it with Signal Cross to mark only those crossovers that happen at the same time as a zone exit.
Visual control
Every element of the oscillator display is adjustable from the panel. The %K Line Color and %D Line Color each have a dedicated color picker and a separate transparency slider, so you can make the %D signal line visually secondary — a pale echo behind the main %K — or give both lines equal visual weight depending on your reading style. Line Width controls the pixel thickness of both lines simultaneously, keeping the display consistent.
The Overbought and Oversold dashed level lines are always visible and adapt instantly when you change the level values in the panel. This means you are never working with a level that has drifted from the visual line — what you see is what the signal uses.
Interactive on-chart panel
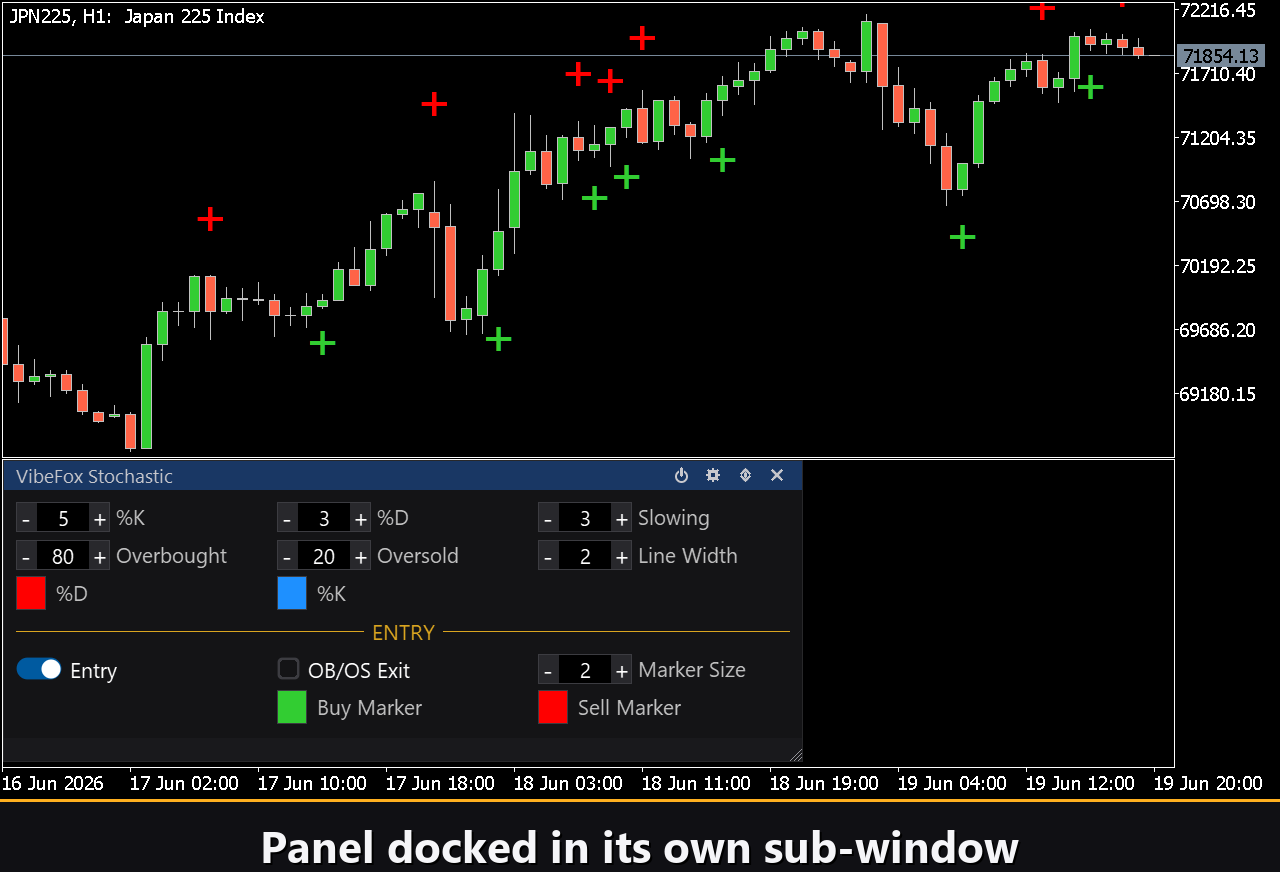
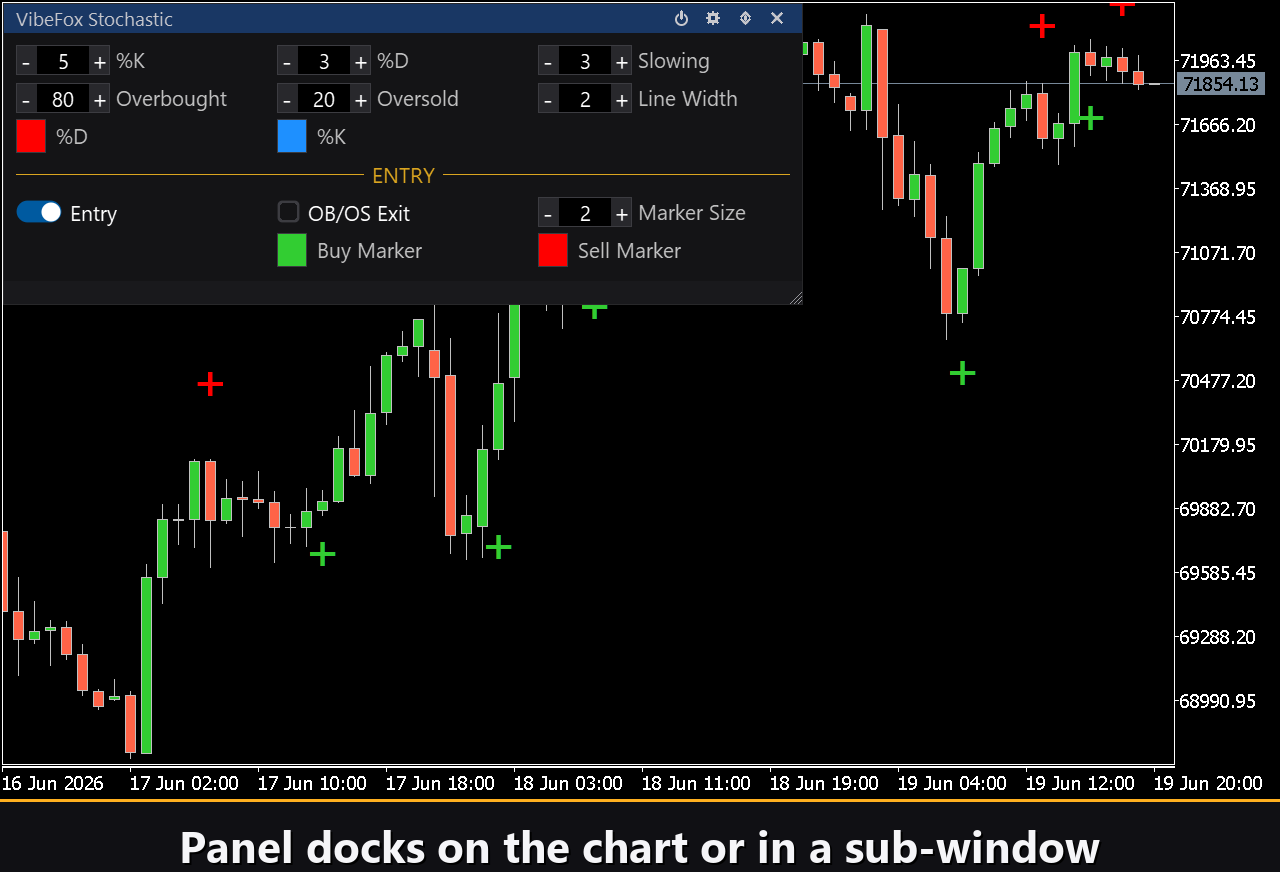
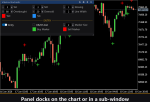
All controls are gathered in a smooth canvas-based panel optimized for mouse interaction. Parameters are arranged in tidy rows across three columns, and the entry signal block is clearly separated so oscillator settings and signal settings never get mixed up. The panel header holds the management icons.
Power — turns the drawing of lines and signals on and off without removing the indicator from the chart.
Settings (gear) — opens and closes the settings section.
Updown (arrows) — moves the panel between the separate subwindow and the main chart.
Close (cross) — closes the indicator.
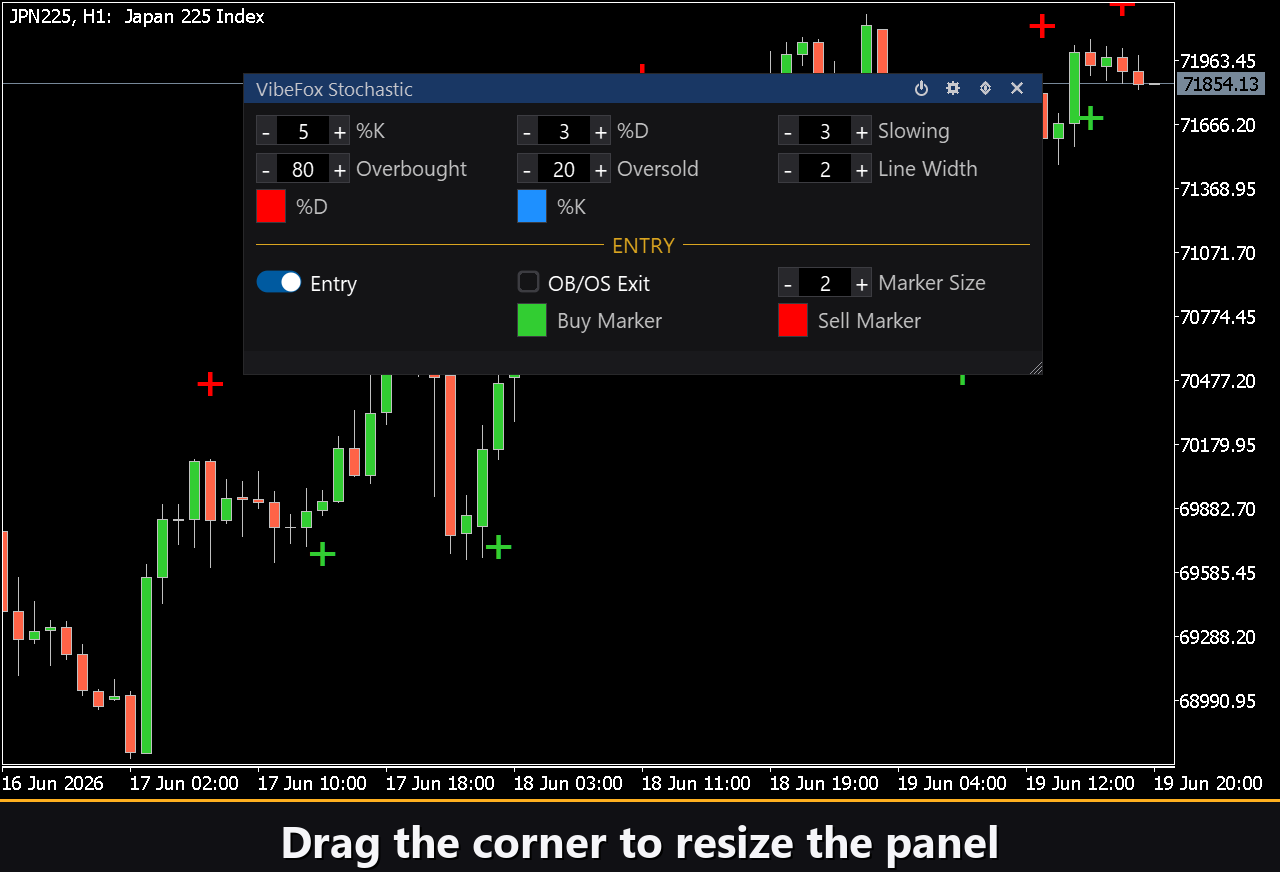
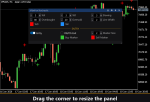
Resizable — drag the bottom-right corner to scale the panel to any size.
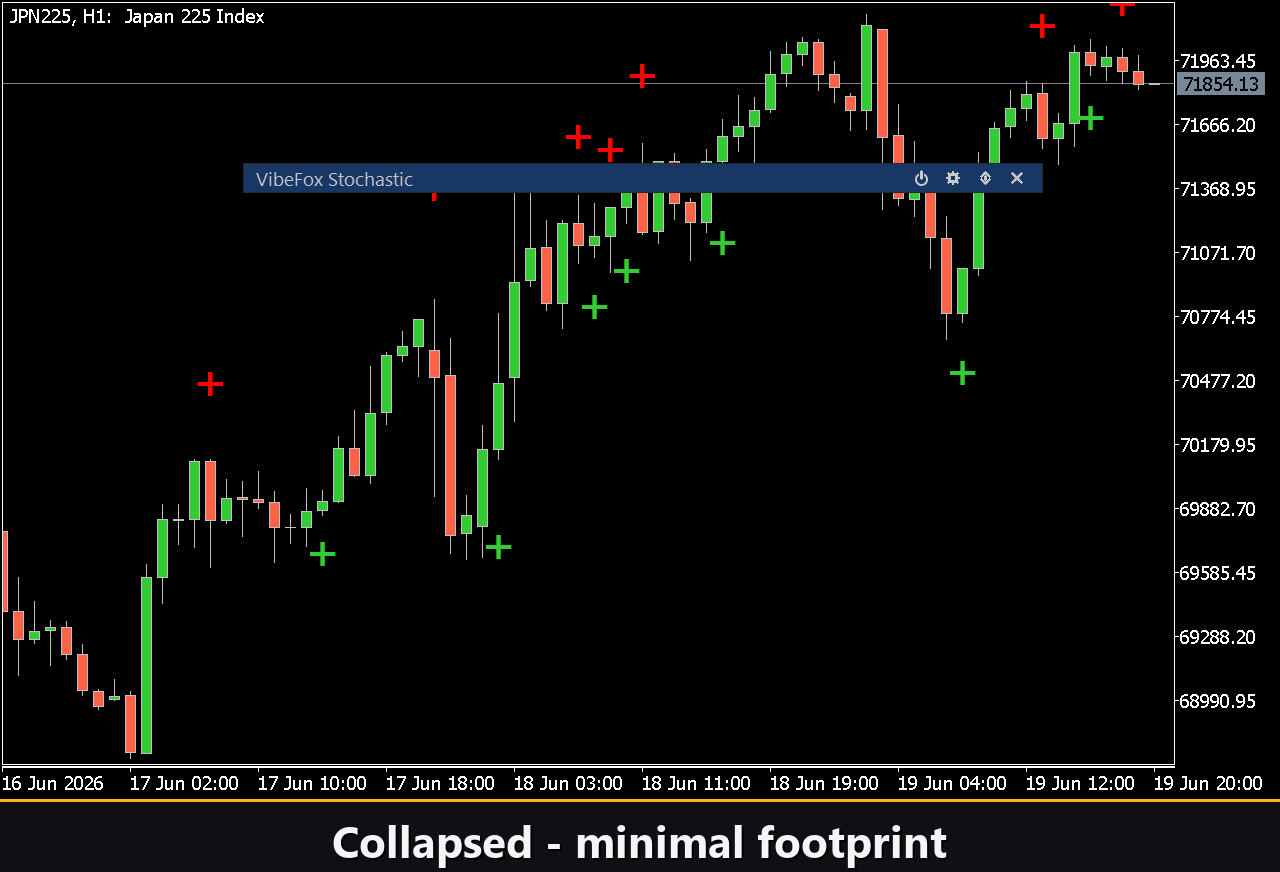
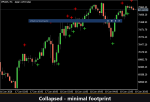
Collapsible — a double click on the header collapses the panel into a compact strip, freeing up screen space.
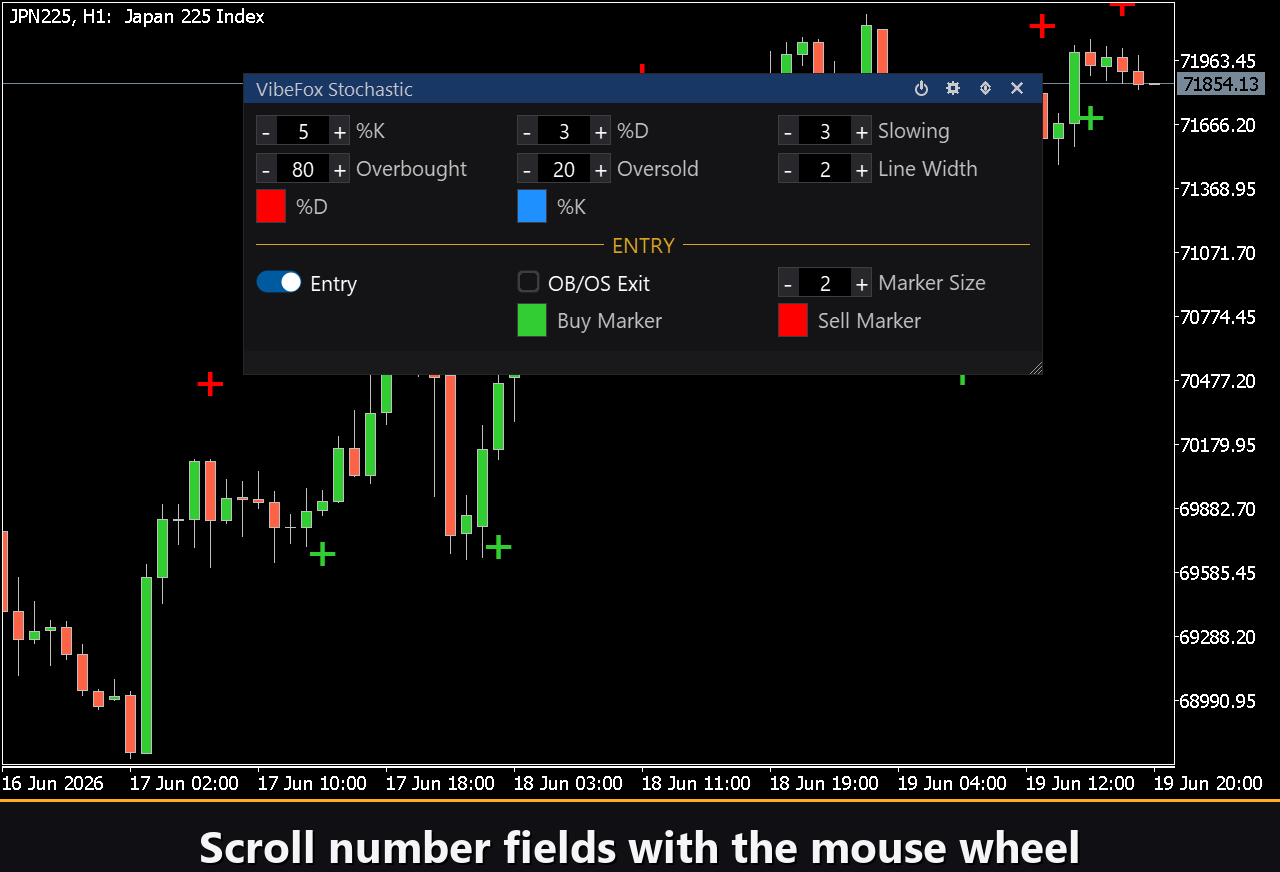
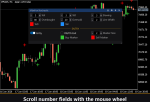
Mouse wheel — hover over any numeric field and scroll the wheel to change its value without opening the keyboard.
Settings and personalization
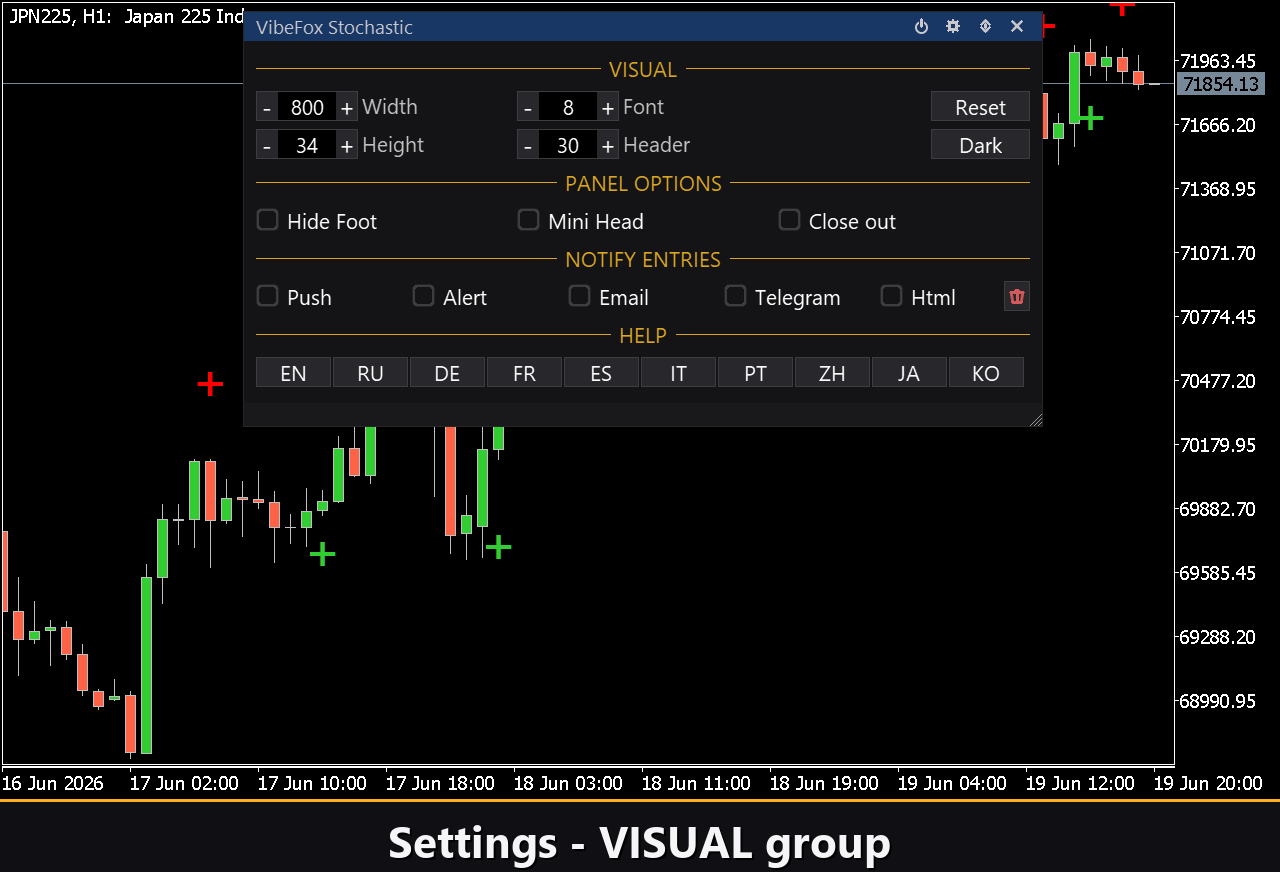
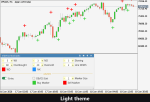
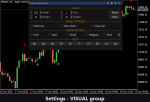
The Settings button opens a dedicated section where the panel appearance is adapted to your workspace. Theme can be set to Auto (follows the chart background color), Dark, or Light — the panel adjusts its colors automatically so it always looks intentional, not accidental. Panel width, header size, row height, and font size are all individually adjustable so the panel fits comfortably whether you trade on a large monitor or a compact laptop screen.
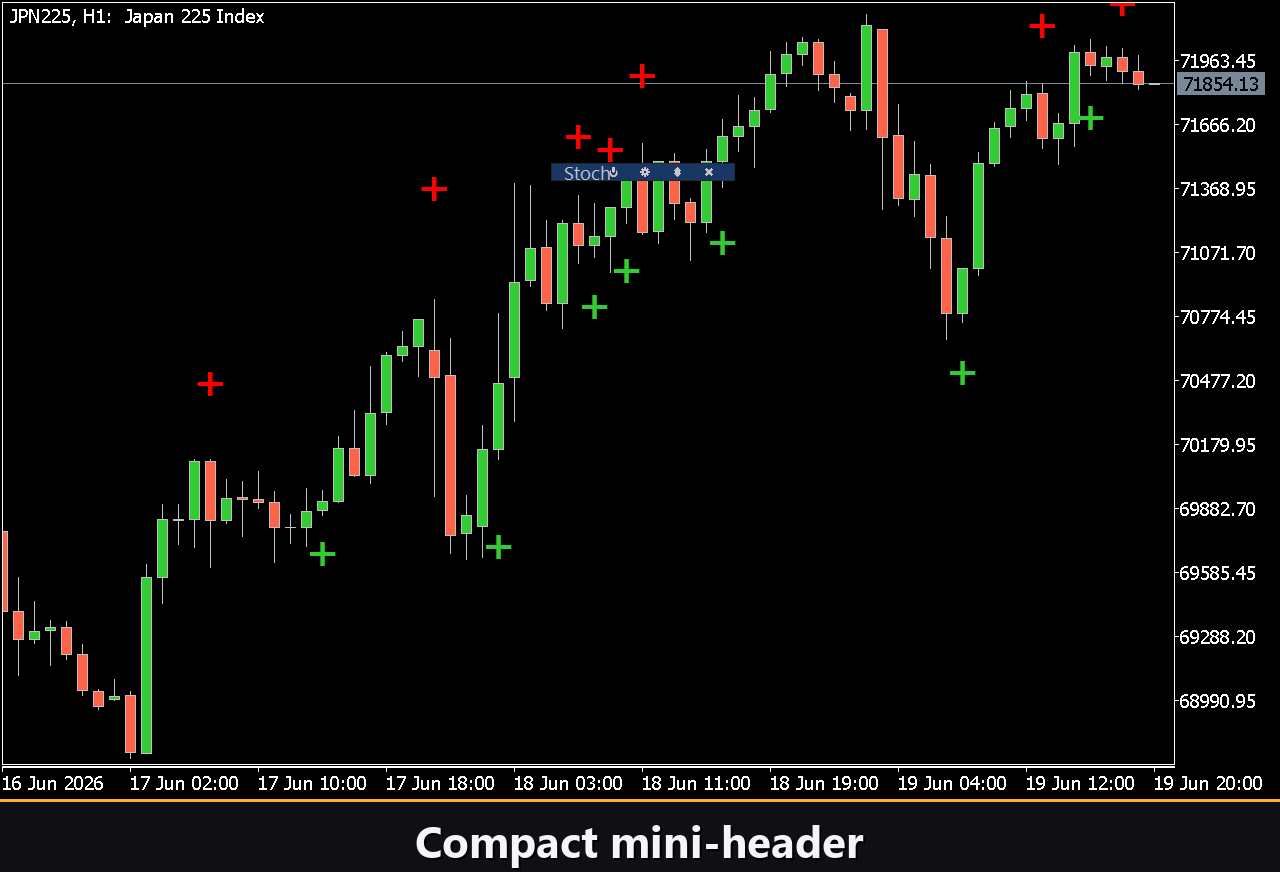
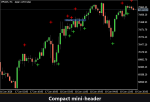
Hide Footer removes the bottom bar of the panel to save vertical space. Mini Header on collapse keeps a thin header strip visible when the panel is collapsed, so you can expand it again with a single click. Close on click outside automatically collapses the panel whenever you click elsewhere on the chart, keeping your view clean.
The Instance number lets you place several independent copies of the indicator on the same chart — for example, one with classic 5/3/3 periods alongside another with slower 14/3/3 periods — without the panels interfering with each other. Panel Start Window controls where the panel opens by default: in the subwindow alongside the oscillator, or on the main chart.
Entry notifications
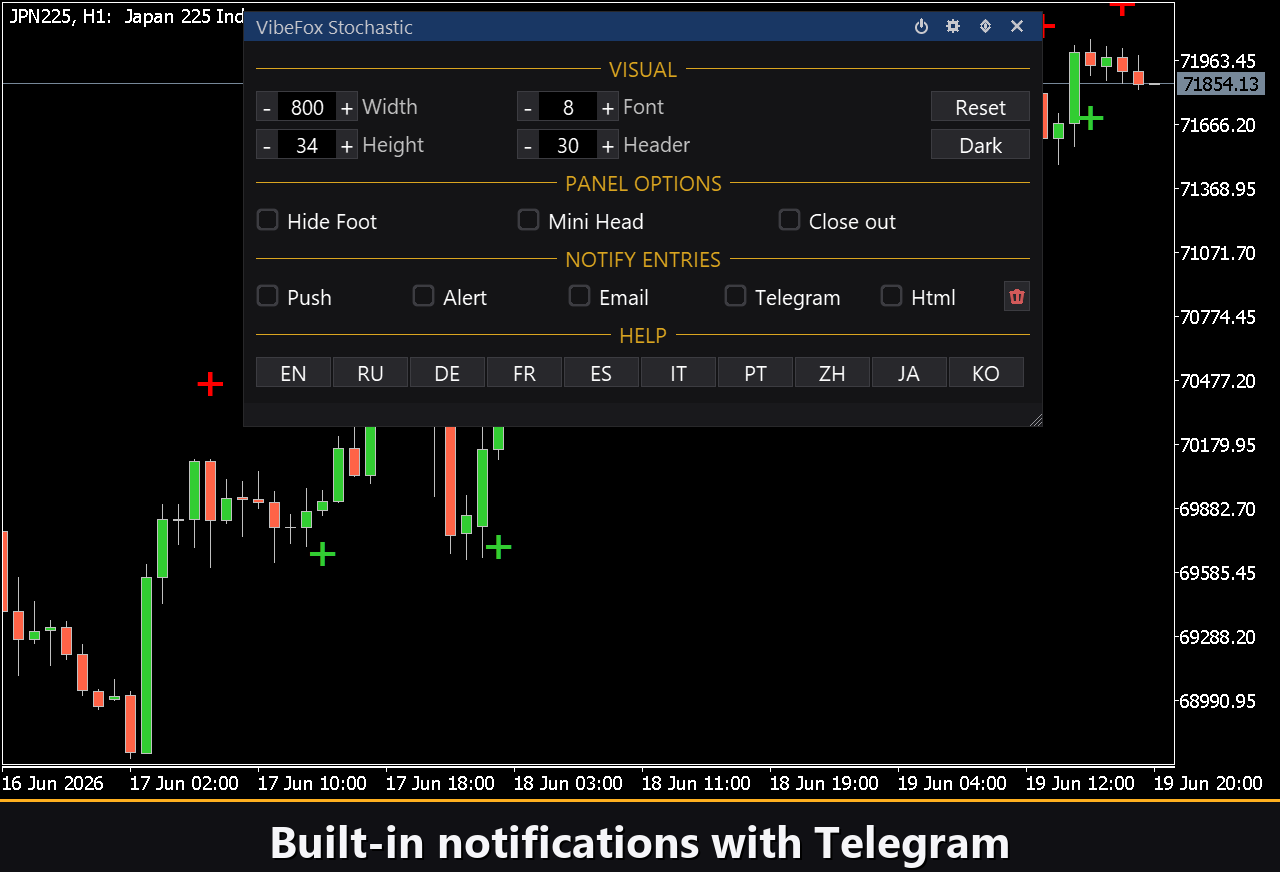
You do not need to watch the chart continuously. Every entry signal can be dispatched through multiple notification channels that are toggled independently directly in the panel.
Alert — a pop-up message window inside the MetaTrader terminal, appearing the instant a signal fires.
Push — a mobile push notification sent to the MetaTrader app on your phone or tablet.
Email — an email sent through the mail settings configured in the MetaTrader terminal.
Telegram — the alert text together with a chart screenshot, sent straight to your Telegram chat.
Visual history (Html report)
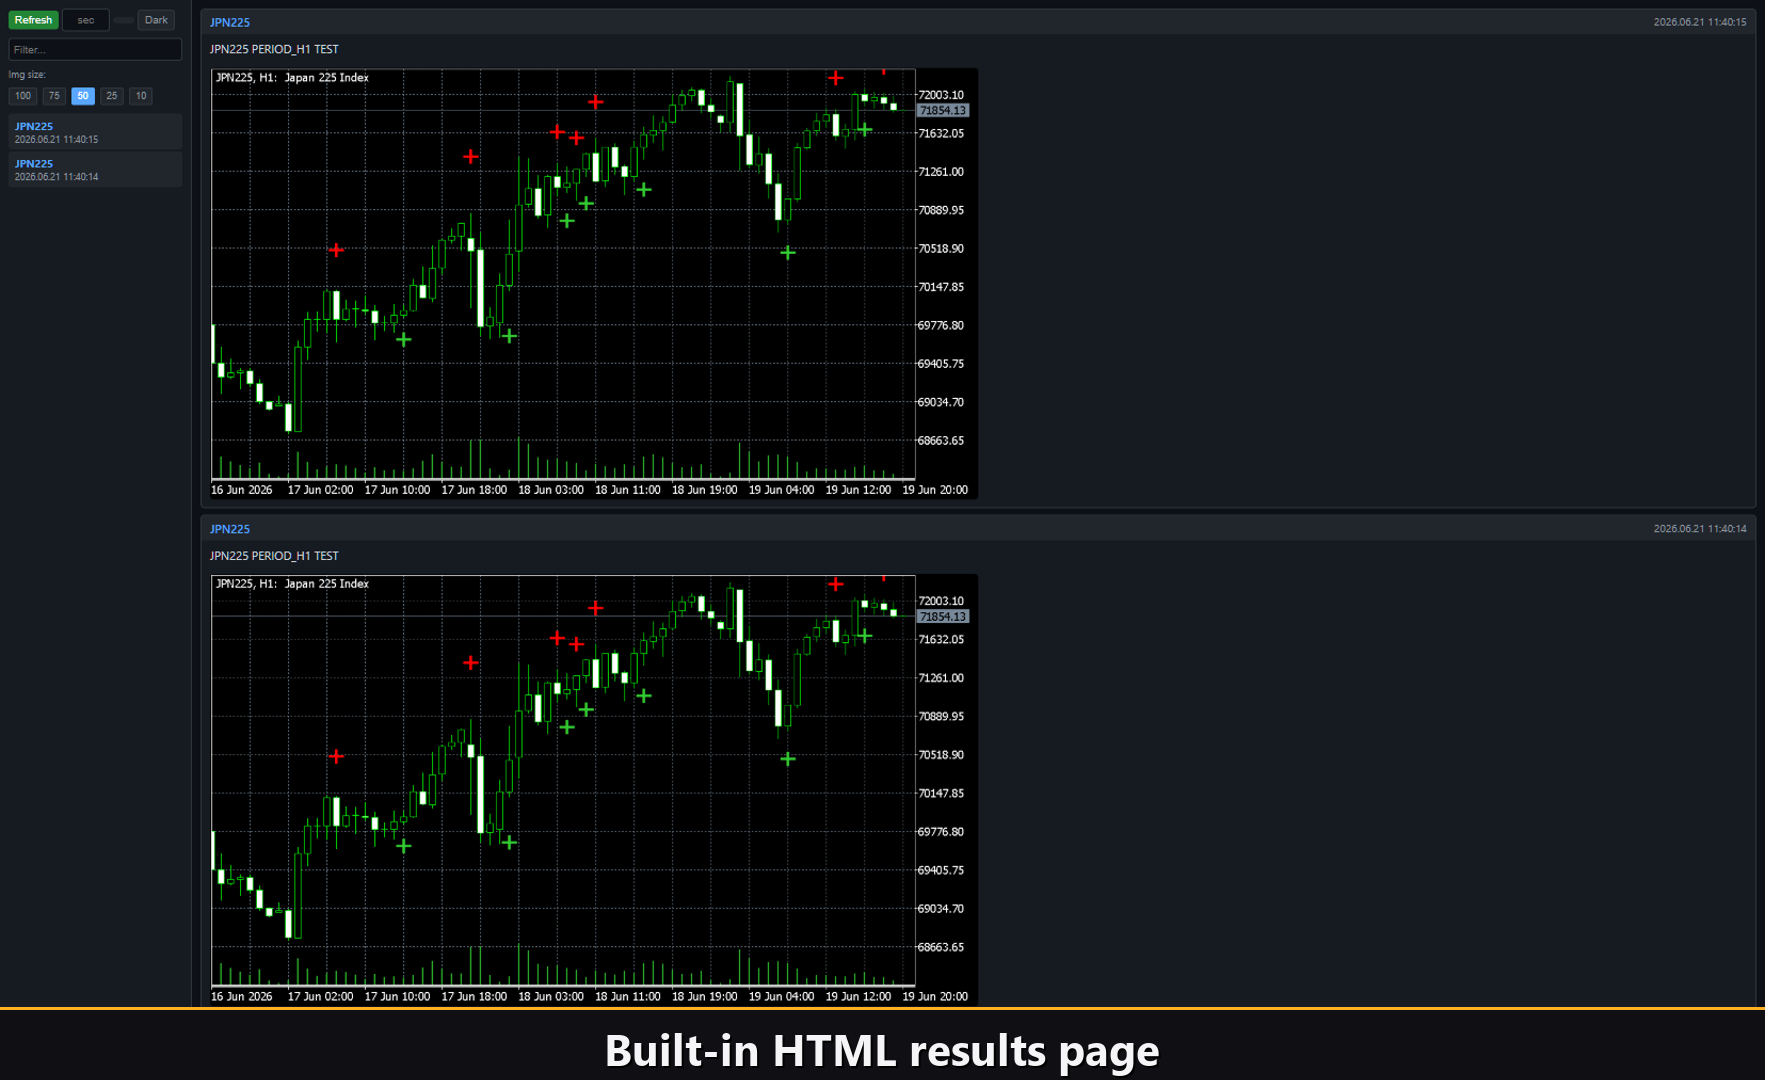
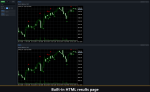
Enable the Html channel, and every entry signal is automatically saved to an HTML report at FilesVibeFox_Stochasticresult.html inside the MetaTrader terminal’s data folder. Each record includes a screenshot of the chart at the exact moment the signal fired, giving you a visual log you can open in any browser. The report accumulates entries across sessions, building a complete picture of what the indicator has found on your symbol and timeframe. A trash button in the panel clears the report and all its screenshots in one click when you want to start fresh.
Telegram Alerts
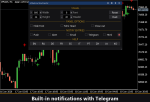
Signals can also be delivered straight to your Telegram chat — the alert text together with a screenshot of the chart at the moment of detection. Turn on the Telegram channel and enter your bot token and chat id in the inputs.
Delivery rides on the HTML report: each new signal is written into the report, and the report — opened in a browser — forwards it to your Telegram chat on its own. For this reason, enabling Telegram automatically keeps the Html report on, and the two channels work together.
Built-in multilingual help
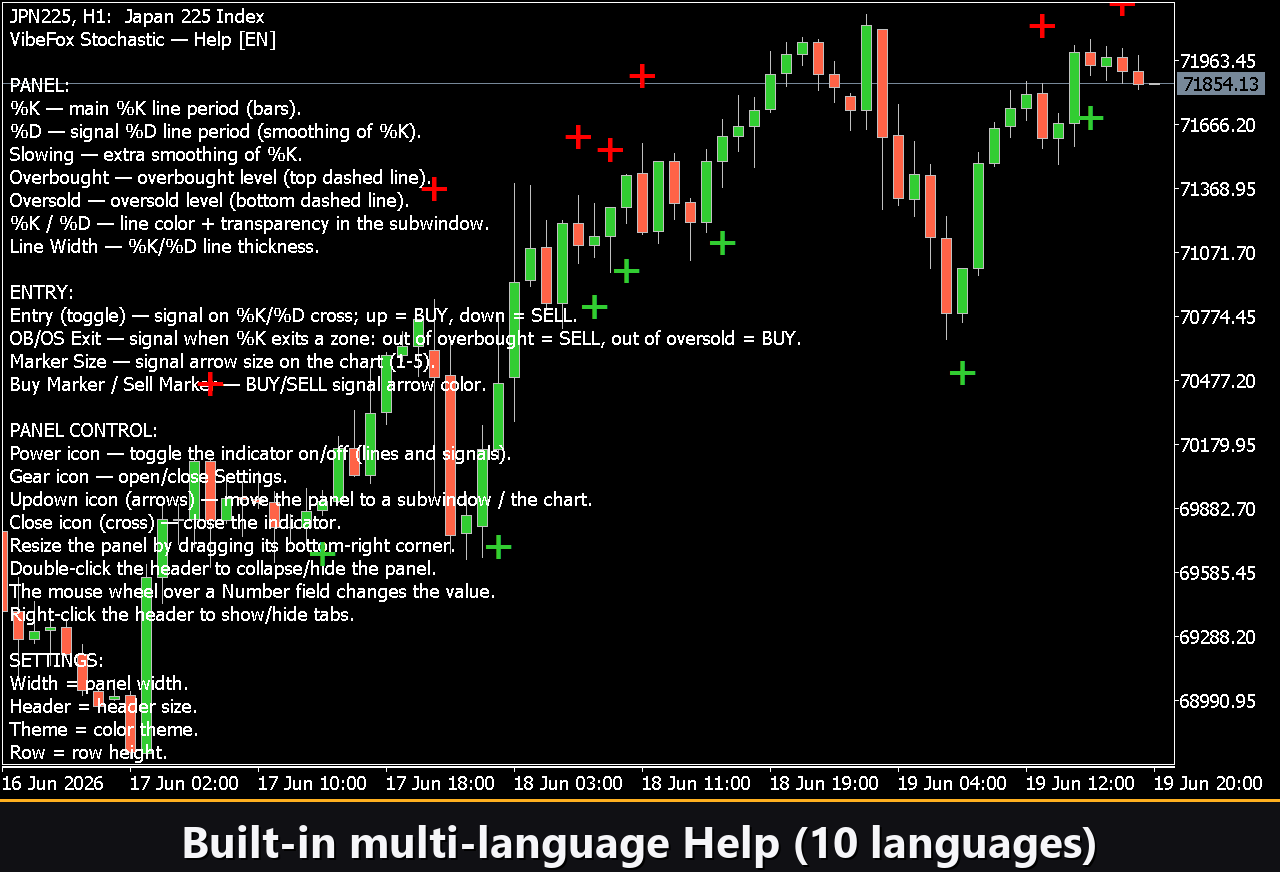
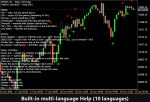
A complete help page is embedded in the panel, available in 10 languages. Every control, parameter, and signal type is explained in context — right where you use it — without needing to consult an external manual.
Loading...
Loading...