








VibeFox Parabolic SAR MT5
30,00 €
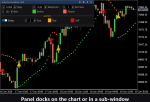
VibeFox Parabolic SAR brings the classic Parabolic Stop-And-Reverse to life with a crisp dotted trail, automatic flip entries, a full set of colors and transparency sliders, and a draggable on-chart panel that lets you tune every setting without ever reopening the Inputs window. It is built to answer one question at a glance – which side of the market is in control right now, and where it is about to change hands.
VibeFox Parabolic SAR – trailing stops, trend direction and stop-and-reverse entries
VibeFox Parabolic SAR brings the classic Parabolic Stop-And-Reverse to life with a crisp dotted trail, automatic flip entries, a full set of colors and transparency sliders, and a draggable on-chart panel that lets you tune every setting without ever reopening the Inputs window. It is built to answer one question at a glance – which side of the market is in control right now, and where it is about to change hands.
What Parabolic SAR does
The Parabolic SAR plots a dotted line of stop levels that trail the price. When the dots sit below the candles, the market is in an uptrend and the dots act as a rising trailing stop. When the dots sit above the candles, the market is in a downtrend and the dots trail downward. The moment price touches the trail, the system stops and reverses – the dots jump to the other side and a new trend leg begins.
Two numbers shape the curve. Step is the acceleration factor: it controls how quickly the dots tighten toward price as a trend extends. Maximum caps that acceleration so the trail never closes in too aggressively. Smaller values produce a loose, patient trail that rides long trends; larger values produce a tight, twitchy trail that flips often. The defaults of 0.02 and 0.20 are the values Welles Wilder published and a sensible starting point for most instruments.
Reading the trail
The indicator draws each dot as an object directly on the price chart, so you see the stop-and-reverse logic exactly where it matters – on top of the candles. Dots below price are bullish and dots above price are bearish, each with its own color so the regime is obvious from across the room. Bars to Analyze sets how far back the trail is calculated and drawn, keeping the chart fast and tidy.
Entry points
VibeFox Parabolic SAR turns the stop-and-reverse moment into a clean, marked signal so you never miss a flip.
Entry – SAR Flip
This is the heart of the system. When the SAR trail crosses from above the price to below it, the trend has flipped up and a BUY marker is drawn. When the trail crosses from below to above, the trend has flipped down and a SELL marker appears. Each flip is both the exit of the previous position and the entry of the next – that is what stop-and-reverse means. A single Entry toggle turns these markers on or off, and you control their look with the Marker Size and the Buy / Sell colors.
Full visual control
Every element is yours to style. Set independent colors for the bullish dots below price and the bearish dots above price, and dial in a transparency from 0 to 100 for each so the trail can sit boldly on top of the candles or fade quietly into the background. Dot Size scales the dots from 1 to 5. The BUY and SELL markers have their own colors, their own transparency sliders, and a shared Marker Size from 1 to 5.
Interactive on-chart panel
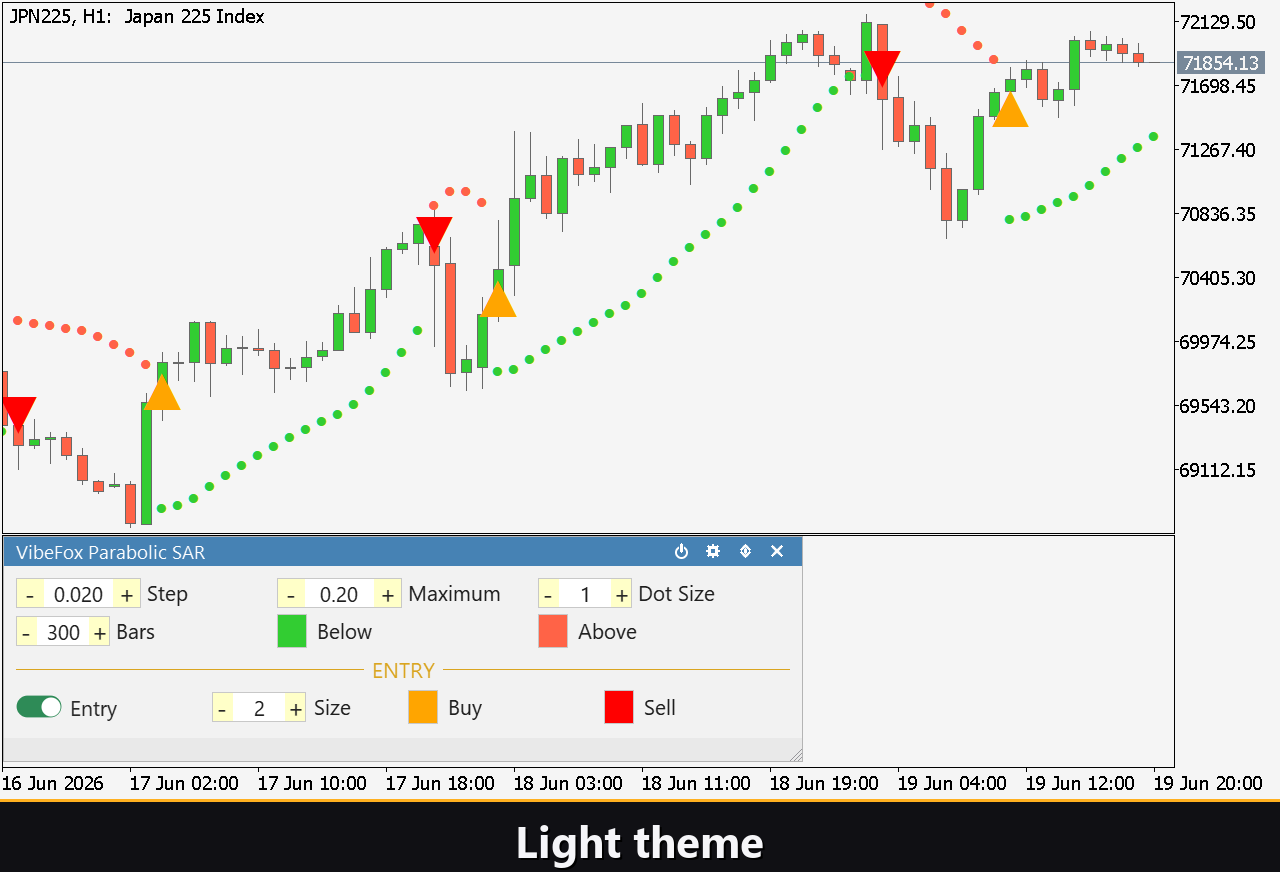
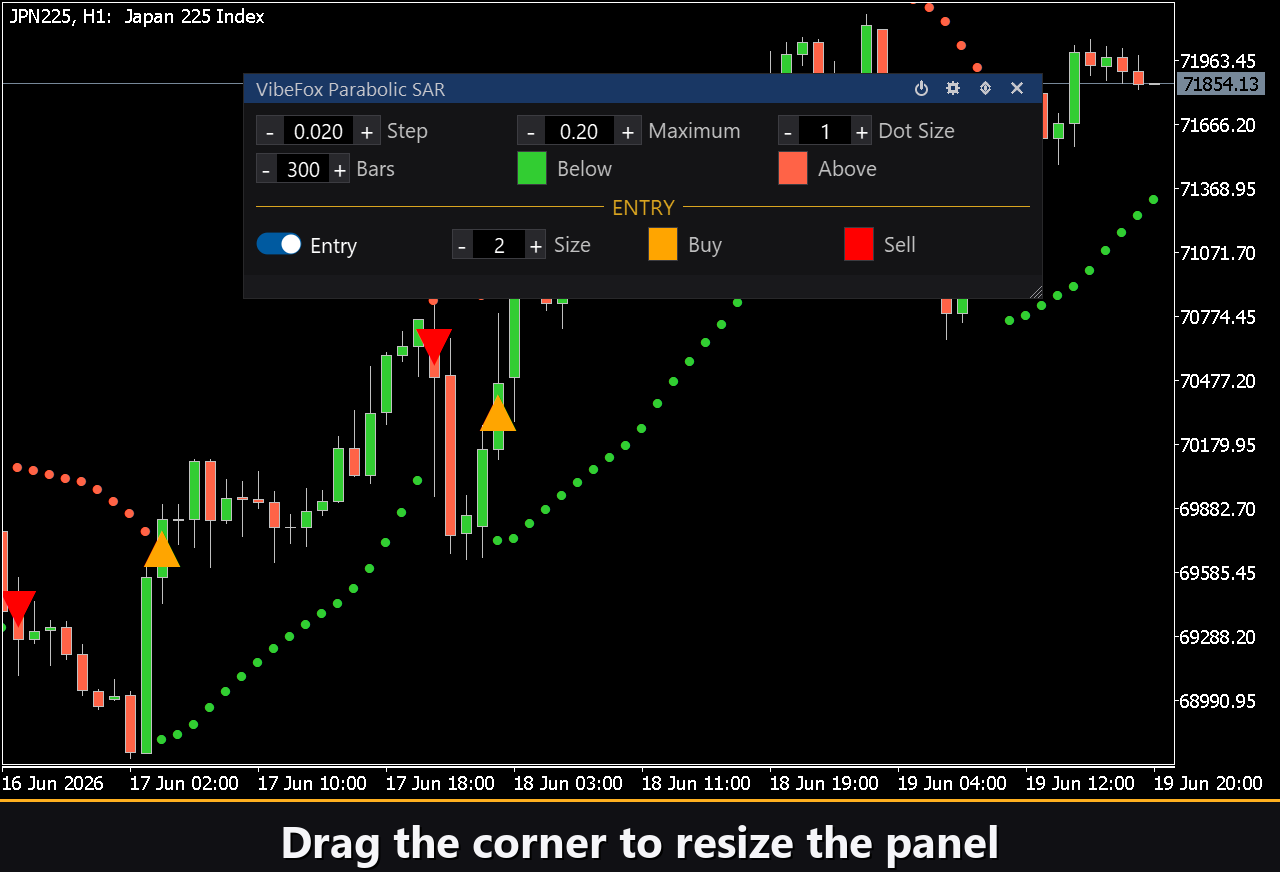
The whole indicator is wrapped in a smooth canvas panel that lives on the chart. Rows are laid out in clean three-column groups, with a gold ENTRY header marking the signal block. Everything you can set in Inputs you can also nudge live from the panel and watch the result instantly.
Power – master switch that turns the indicator drawing on or off without removing it from the chart.
Settings – the gear icon opens the personalization section where you restyle the panel itself.
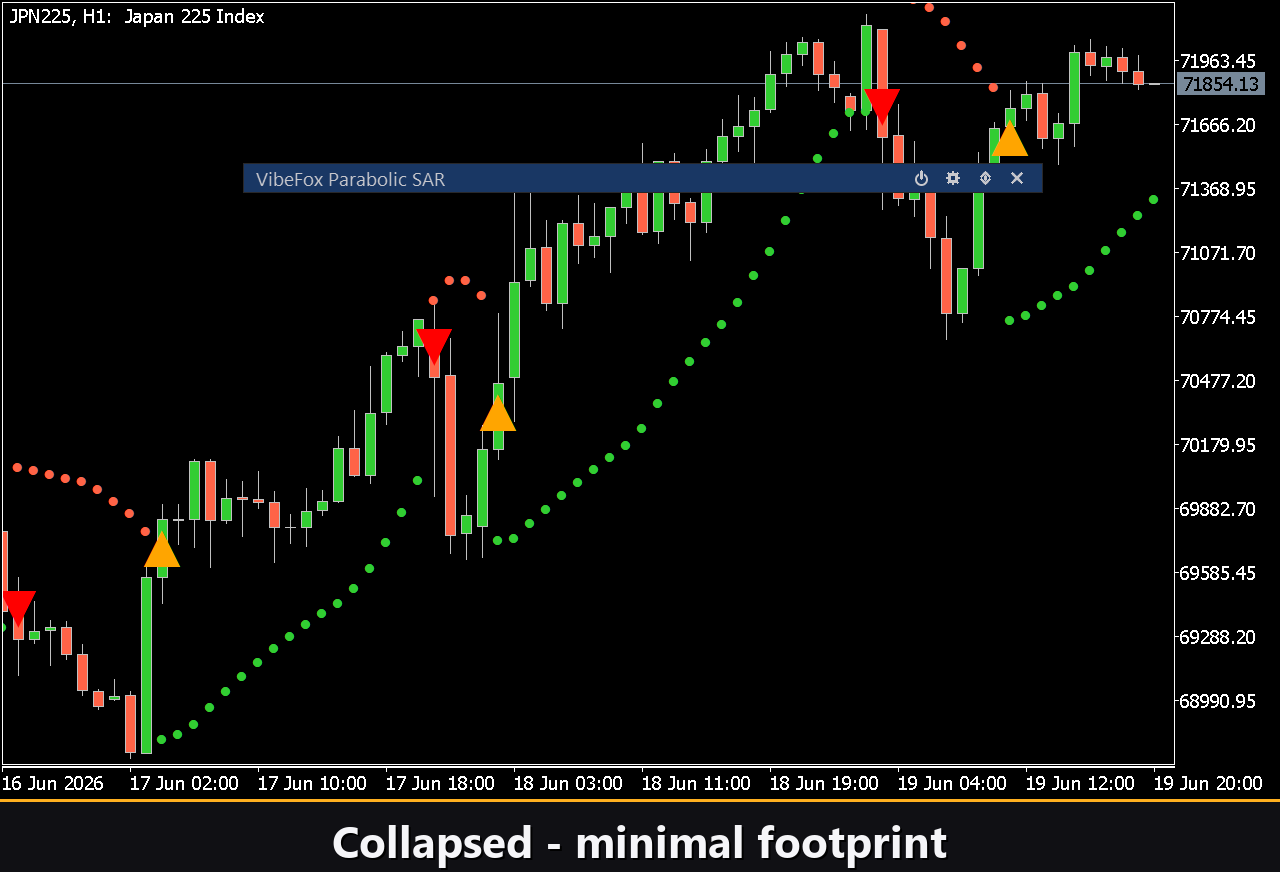
Updown – collapses the panel down to its header so it takes almost no space, then expands it again.
Close – hides the panel from the chart.
Resizable – grab the corner and drag to resize the whole panel to taste.
Collapsible – double-click the header to fold and unfold the panel in one gesture.
Mouse wheel – scroll over the panel to move through its rows when content is taller than the visible area.
Settings and personalization
Open Settings with the gear icon to make the panel feel like yours.
Theme – choose Auto, Dark or Light. Auto follows your chart background.
Panel width – set the panel width in pixels.
Header size – scale the header from compact to bold.
Row height – tighten or loosen the spacing between rows.
Font size – pick the text size that reads best for you.
Hide Footer – remove the footer strip for a cleaner look.
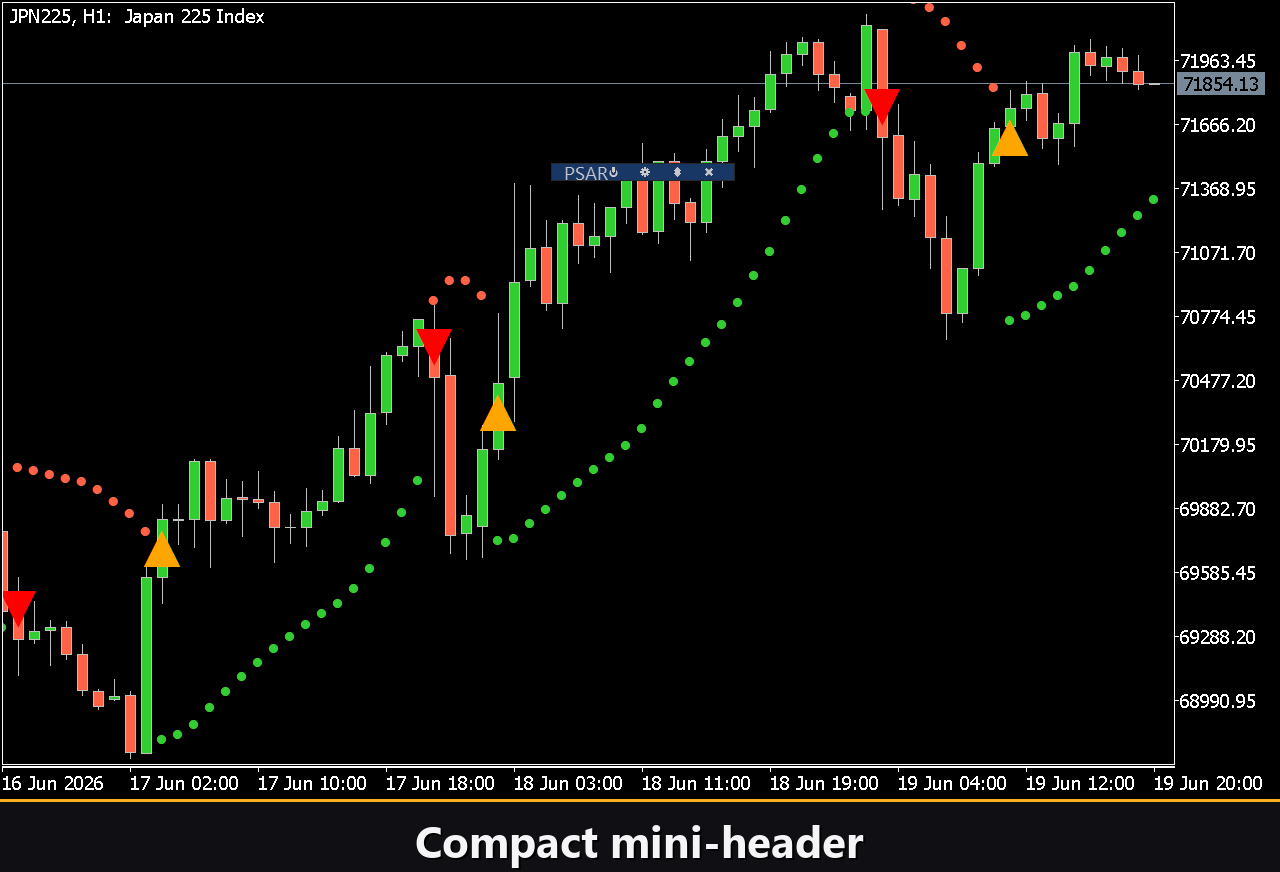
Mini Header – show a slim header when the panel is collapsed.
Close outside – close the panel automatically when you click anywhere outside it.
Instance – give each copy a unique number so several charts or several copies on one chart never clash.
Start window – launch the panel in the indicator Subwindow or directly on the main Chart.
Entry notifications
Never sit glued to the screen waiting for a flip. Each SAR Flip can fire the alerts you choose, on the channels you choose.
Alert – a pop-up alert inside the terminal.
Push – a push notification to your phone through the mobile terminal.
Email – an email sent through your terminal mail settings.
Telegram — the alert text together with a chart screenshot, sent straight to your Telegram chat.
Visual history – Html report
Switch on the Html channel and every signal is logged into a self-contained visual report, complete with a chart screenshot captured at the moment of the flip. The file is written to the terminal Files folder under VibeFox_ParabolicSAR and opens in any browser, so you can review your trail history candle by candle long after the moment has passed. A trash button on the panel clears the report whenever you want a fresh start.
Telegram Alerts
Signals can also be delivered straight to your Telegram chat — the alert text together with a screenshot of the chart at the moment of detection. Turn on the Telegram channel and enter your bot token and chat id in the inputs.
Delivery rides on the HTML report: each new signal is written into the report, and the report — opened in a browser — forwards it to your Telegram chat on its own. For this reason, enabling Telegram automatically keeps the Html report on, and the two channels work together.
Built-in multilingual help
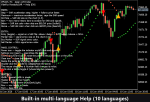
A full Help section lives right inside the panel in 10 languages, so the explanation of every dot, marker, control and setting is always one click away in your own language – no need to leave the chart.
Loading...
Loading...